
Introduction to Microsoft Insights#
Overview#
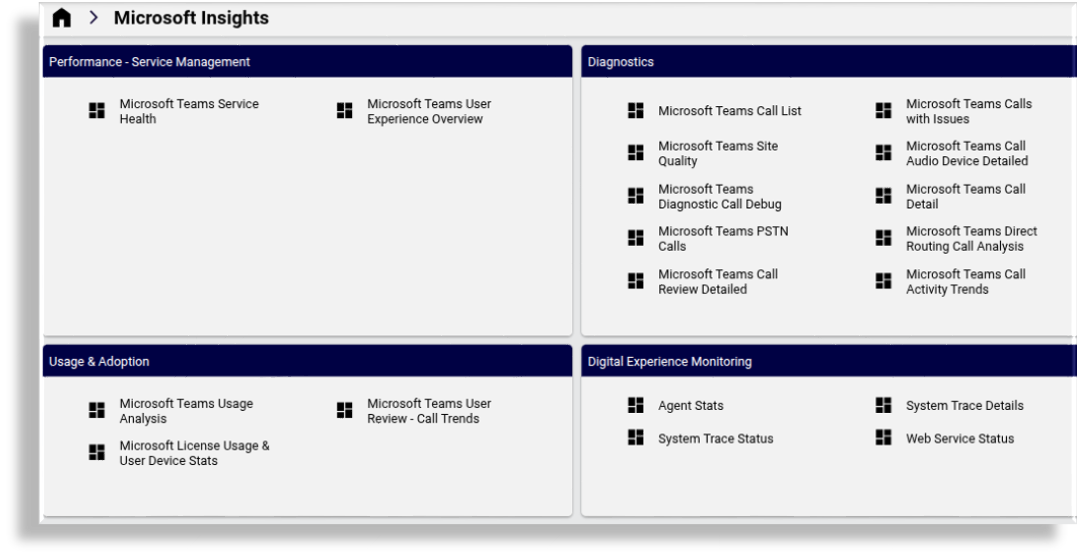
The Microsoft Insights menu provides a single entry point dashboard to access a range of Microsoft performance, diagnostics and usage data presented in individual dashboards.
It includes Digital Experience Monitoring analytics that allows users to deploy and manage Insights agents and testing profiles to obtain a view on the health of such digital services as Microsoft Teams or Cisco Webex.
The sections below
indicate the requirements to view and use these dashboards
provide references to additional details
include details on the Digital Experience Monitoring dashboards and setup.
Requirements#
The Microsoft Insights menu is by default available to administrators on Automate where the following requirements are set:
The Global Settings, Enabled Services shows Enable Microsoft as true. See: Global settings
The system is licensed for Insights Collaboration Assurance. This allows for access to the assurance data source used in dashboards. See: Licensed Applications under Manage your Automate product license
Performance - Service Management#
Diagnostics#
Usage & Adoption#
Digital Experience Monitoring (DEM)#
Overview and setup#
The following configuration requirements need to be completed in order to use the DEM dashboards:
During arbitrator setup (see Arbitrators, Microsoft Tenant users are synced in to the Arbitrator hierarchy by using the Sync in Microsoft Tenants menu.
DEM Agent installation and configuration
See Digital Experience Monitoring (DEM) Agent Installation
DEM Agent Stats#
Provides an at-a-glance view of agent connectivity, web performance, and system statistics to monitor and optimize digital experience.
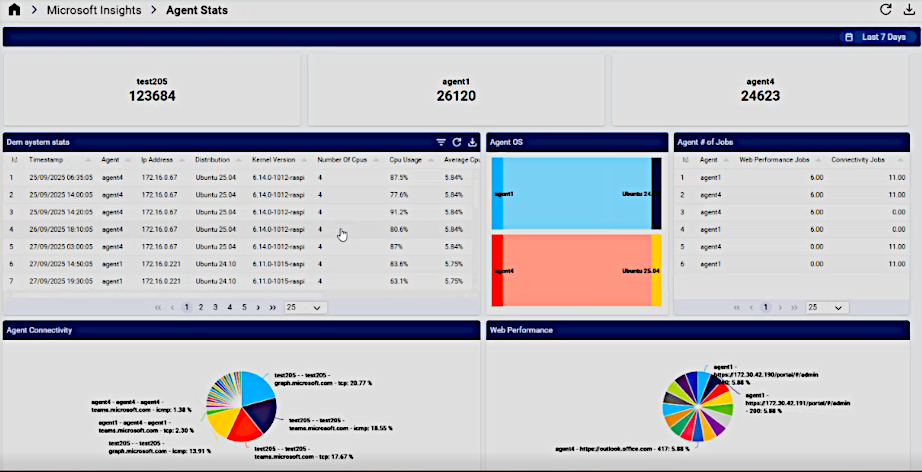
For further details, see: DEM Agent Stats
DEM System Trace Details#
Provides detailed metrics on system connectivity, including ASN and hop-based insights into latency, jitter, packet loss, and trace details for performance monitoring.
An example dashboard is shown below:
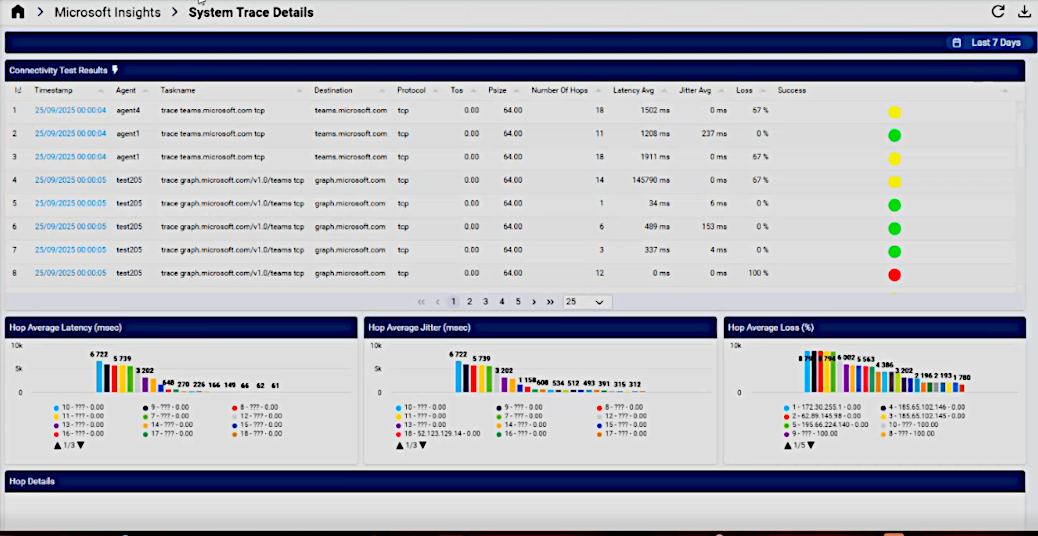
For further details, see: DEM System Trace Details
DEM System Trace Status#
Offers a detailed view of system trace performance, highlighting top ASNs and destinations with the highest latency, jitter, and packet loss, alongside connectivity test results for comprehensive monitoring.
An example dashboard is shown below:
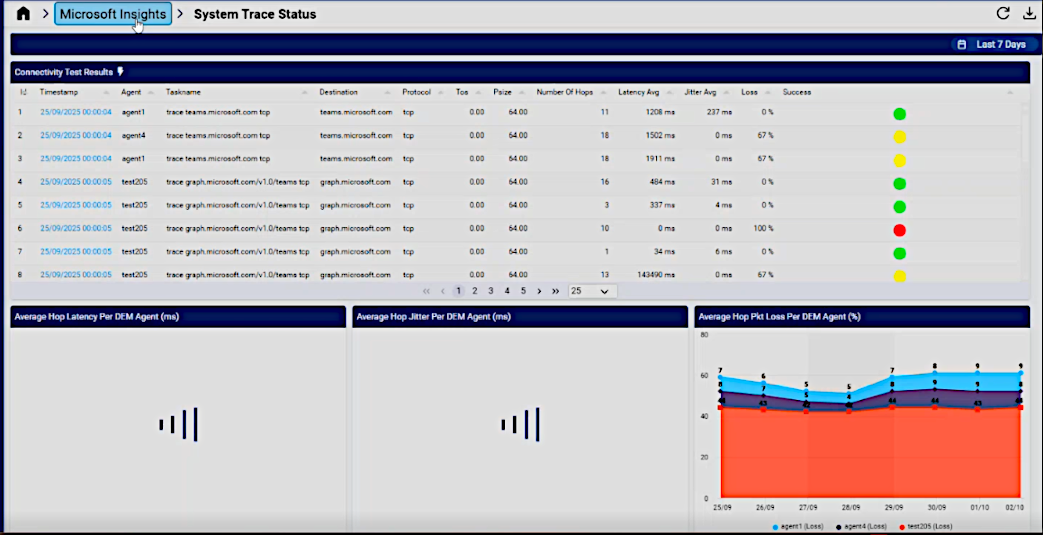
For further details, see: DEM System Trace Status
DEM Web Service Status#
Provides insights into web service performance metrics such as response times, connection times, and error messages, with trends and detailed test results for enhanced monitoring and optimization.
An example dashboard is shown below:
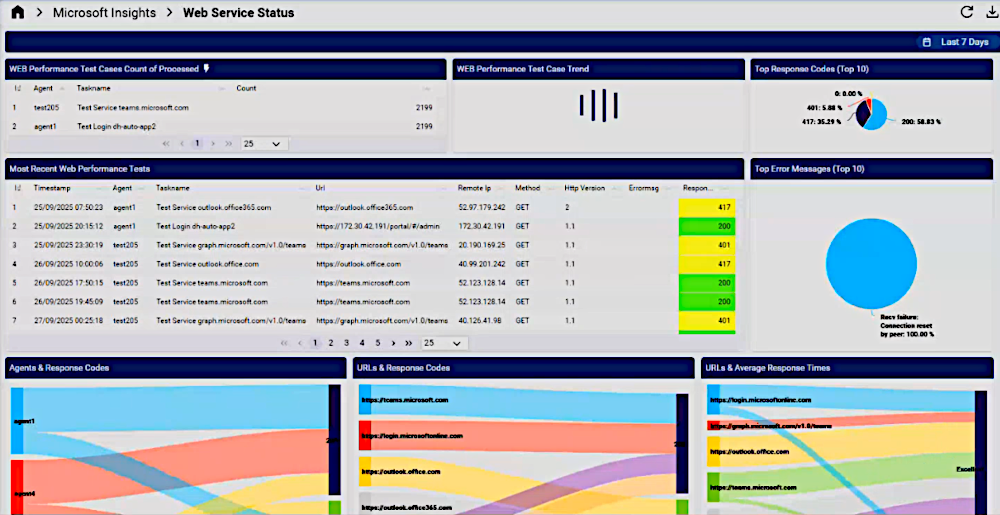
For further details, see: DEM Web Service Status