
UC Monitoring Menu#
UC Monitoring
VOSS provides several default dashboards that you can copy (clone) and edit to create your own custom dashboards.
Menus, dashboards and widgets on dashboards may depend on the availability and enabledment of additional services on Global Settings > Enabled Services.
Requirements:
Solution enabled: Global Settings > Enabled Solutions > Enable UC Monitoring Solution - see: Global settings.
Required services enabled (for example: Cisco CUCM, Cisco CUCX, Microsoft): Global Settings > Enabled Services - see: Global settings.
Assurance data sources configured:
Collector (Arbitrator) installation and configuration: Insights Assurance Arbitrators
Digital Experience Monitoring (DEM) Agent: Digital Experience Monitoring Agents and Profiles
Dashboard customization:
Alerting#
Dashboard reference:
-
Overview of alerts and alerting assets.
Diagnostics - Monitoring#
Cisco Microsoft Webex
Required services enabled: Microsoft, Cisco CUCM/CUCX/Webex/UCCX
Provides default dashboards with diagnostics monitoring details grouped by enabled service.
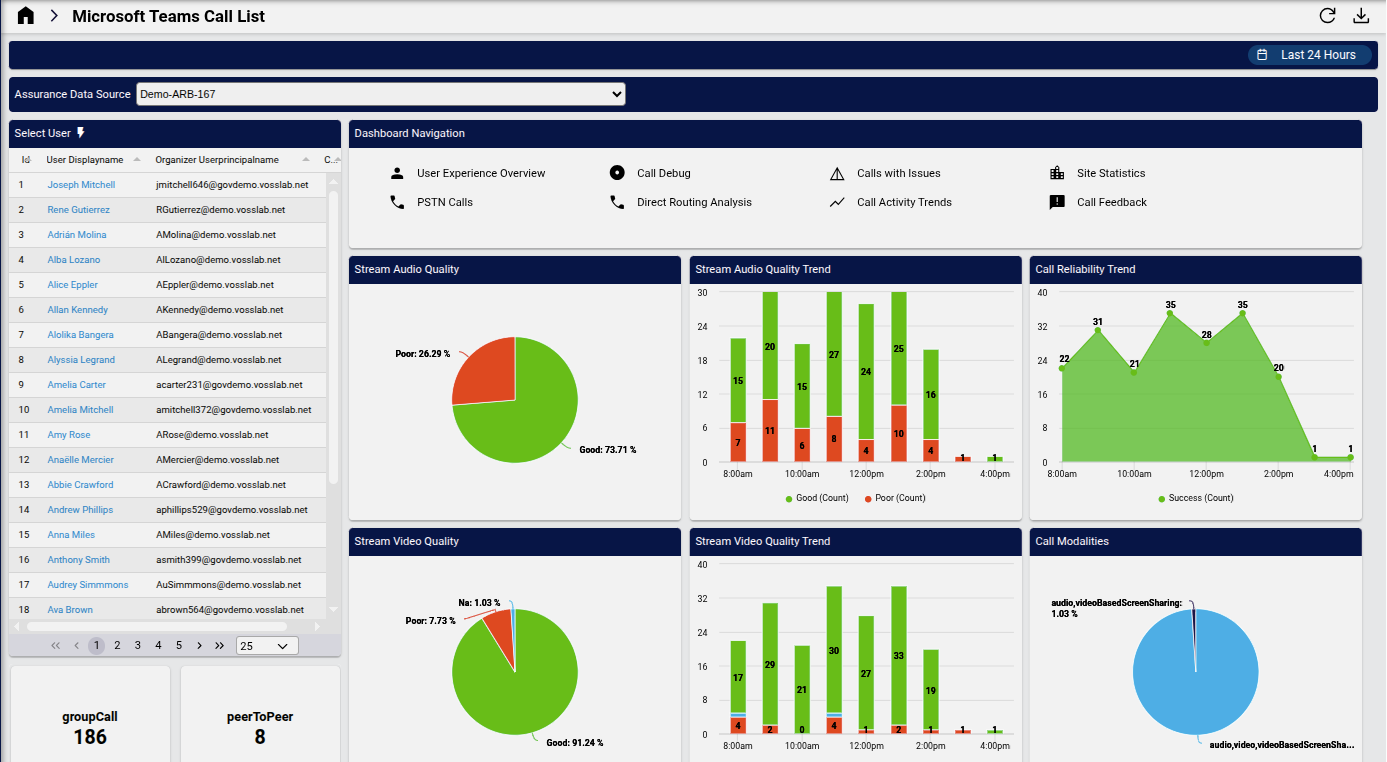
Example default dashboard: Microsoft Teams Call List:
Dashboard reference:
-
A collection of diagnostic dashboards. The panels in the collection are available and grouped by services which need to be enabled: Microsoft, Cisco CUCM/CUCX/Webex/UCCX.
Microsoft Diagnostics#
Insights Microsoft Teams Call List
Troubleshoot call, video, and VBSS quality - link to additional call related dashboards.
Insights Microsoft Teams User Experience Overview
Audio quality details with associated device information.
Insights Microsoft Teams Calls with Issues
Calls with audio, video, sharing issues and affected users.
Insights Microsoft Teams Diagnostic Call Debug
Drill down on specific users to view issues affecting quality, including session & stream, network and device details.
Insights Microsoft Teams Call Activity Trends
Call activity and quality trends.
Insights Microsoft Teams Call Feedback
End user feedback analysis.
Insights Microsoft Teams Site Quality
Audio, video, sharing quality and call lists by site.
Insights Microsoft Teams PSTN Calls
PSTN call analysis and trends.
Insights Microsoft Teams Direct Routing Call Analysis
Direct routing call analysis and trends
Cisco Webex Diagnostics#
Webex
-
Detailed list of calls.
-
Host and participant details.
Insights Webex Meetings Quality
Meetings quality analysis across modalities.
Performance - Service Management#
Microsoft Cisco
Insights - Performance - Service Management
A collection of dashboards providing insights Microsoft, Cisco UC performance.
Microsoft Performance - Service Management#
Insights Microsoft Teams Service Health
Service health and status reported by Microsoft across all services.
Insights Microsoft Teams User Experience Overview
Audio quality details with associated device information.
Digital Experience Monitoring#
Provides default dashboards with insights into synthetic testing.
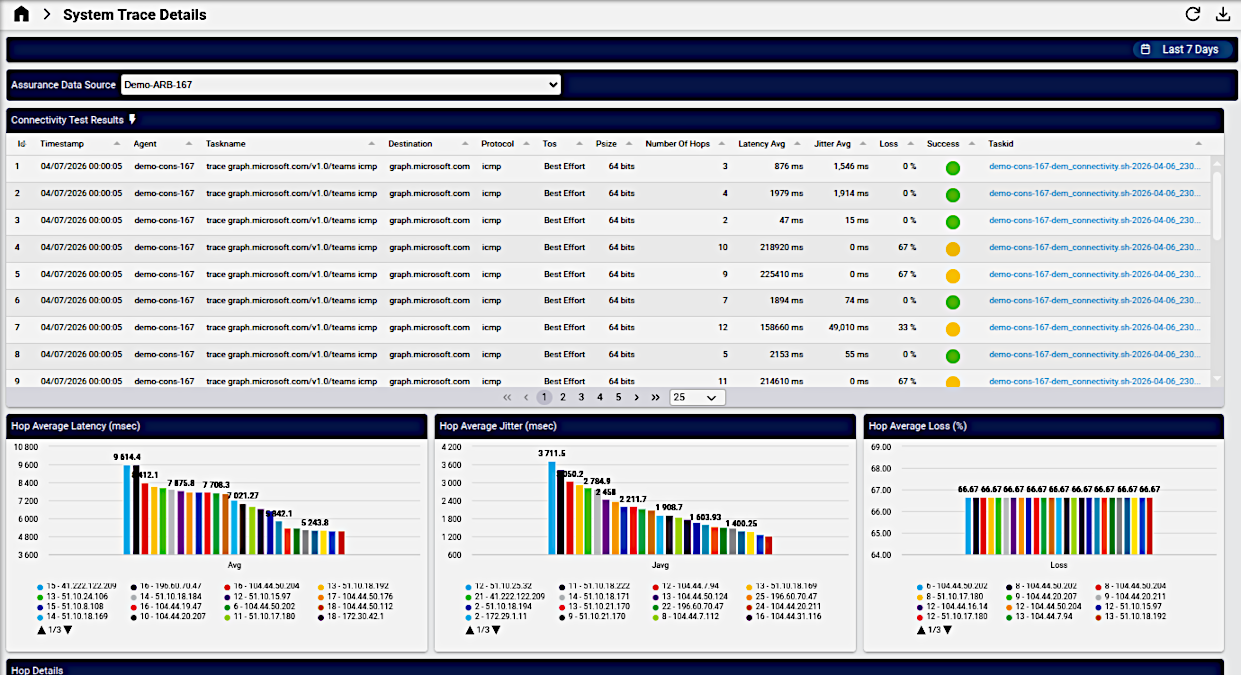
Example default dashboard: DEM System Trace Details:
Dashboard reference:
Insights - Digital Experience Monitoring
A collection of dashboards providing insights into synthetic testing.
-
Provides an at-a-glance view of agent connectivity, web performance, and system statistics to monitor and optimize digital experience.
-
Provides detailed metrics on system connectivity, including ASN and hop-based insights into latency, jitter, packet loss, and trace details for performance monitoring.
-
Offers a detailed view of system trace performance, highlighting top ASNs and destinations with the highest latency, jitter, and packet loss, alongside connectivity test results for comprehensive monitoring.