
Anomaly Detection Usage#
Note
This feature is only available in a SaaS model from a VOSS hosted and managed cloud solution.
Overview#
VOSS provides an intelligent anomaly detection framework that leverages machine learning and AI agents to proactively identify problems before they impact users. Unlike traditional monitoring which relies on static thresholds you manually define, this framework learns what “normal” looks like in your specific environment and automatically flags deviations using context-aware intelligence.
The framework works across data that is already accessible in VOSS to detect anomalies in service quality metrics, configuration drift from an admin-defined baseline, and call patterns across the following categories:
Service Issues: Performance degradations and availability problems
Configuration Drift: Unauthorized or unintended configuration changes
Performance Degradations: Abnormal resource utilization patterns
Detected anomalies are stored as records with severity levels, confidence scores, AI-generated root cause analysis, and recommended remediation steps.
Key Concepts#
Anomaly Detection Config
The central configuration object that defines how a detection run is executed. It ties together a natural language detection question, a data source, a detection method, and optionally a playbook.
Agent Playbook
A JSON file that provides the AI agent with a structured, step-by-step execution plan. Playbooks define the goals and rationale for each step, which tools to call, and what to do with the results.
Pre-built playbooks are available as examples.
Golden State / Baseline
A reference configuration snapshot used as the “known-good” state for configuration drift detection. Deviations from this baseline are flagged as anomalies.
Anomaly Record
A persisted record created when a significant deviation is detected. Each record includes an anomaly type, affected resource, severity, confidence score, and an AI-generated description.
Common Use Cases#
see: Reference.
License Utilization Tracking#
Monitor license usage trends over time and detect anomalies before you hit limits or incur unexpected costs. Use time_series_anomaly detection with a time_window of "30d" and target your license data source.
User Configuration Drift Detection#
Track changes to user admin configurations and identify when settings deviate from the desired state - critical for security compliance and change management.
Example config:
detection_question: "Tell me when any admin configuration for the role changes from the desired state"
datasource: "User Admin"
detection_method: "config_drift_analysis"
baseline_snapshot_id: "golden-state-001"
Call Quality Monitoring#
Detect jitter spikes, packet loss events, and other call quality degradations across your user base, accounting for time-of-day and day-of-week patterns.
Example config:
detection_question: "Detect unusual patterns in call quality metrics"
detection_method: "time_series_anomaly"
playbook: "/api/data/AgentPlaybook/anomaly_time_series"
time_window: "7d"
Getting Started#
Create a Configuration#
The detection instance is created and managed for resources at a required hierarchy level in VOSS, for example at Provider, Customer, and Site level.
Navigate to the required hierarchy and select the Anomaly Detection > Configuration menu and complete the required fields.
The configuration applies to the selected target hierarchy level (Provider, Customer, or Site).
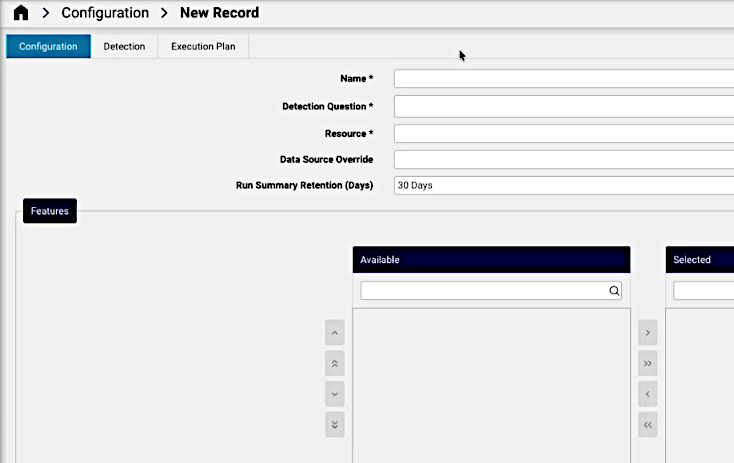
On the Configuration tab:
A descriptive Name for the detection, unique for this configuration
A natural language Detection Question of what to detect. The formulation can refer to the detection method to ensure the relevant intention.
Resource: the ReporterResource relevant to the detection question. Attributes of the resource relate to the detection question.
A Data Source Override: if necessary, override the default data source for this configuration (business key reference).
Features: optionally, manually use the transfer boxes to select. Otherwise, the AI agent identifies the relevant attributes based on the detection question and resource. Resource attributes relevant to the detection question.
Run Summary Retention (Days): for new configuration runs, an initial retention value in days can be selected (default is 30 days).
Create Detection Details#
On this tab, input can be added to specify the desired state (Golden State / Baseline) information from which anomalies are to be detected.
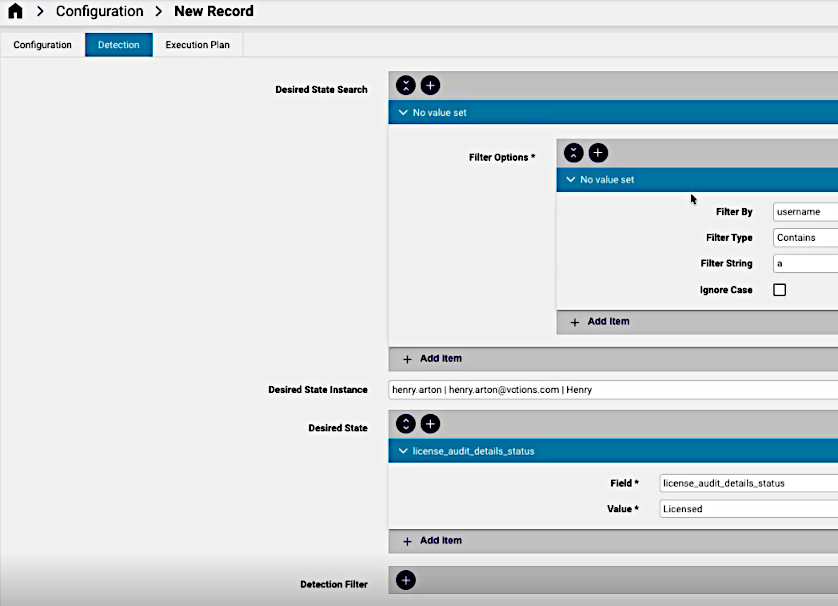
On the Detection tab, you can add filter data if required:
Desired State Search: any search filters required.
Desired State Instance: an instance of the desired state.
Desired State: the attribute key-value of the desired state.
Detection Filter: if required, filter groups for the detection. Filter options can apply within the group.
The example image below shows a Desired State value for a feature attribute of the resource.
At this stage, the configuration can be saved. Click the Save button.
When this configuration is then re-opened on the GUI, a Generate Execution Plan menu option is available to allow for the automated AI generation of the execution plan.
Execution Plan#
Automated Execution Plan#
If the Generate Execution Plan menu option is selected and plan execution transactions have been completed, a Playbook Configuration instance is added to the anomaly detection configuration.
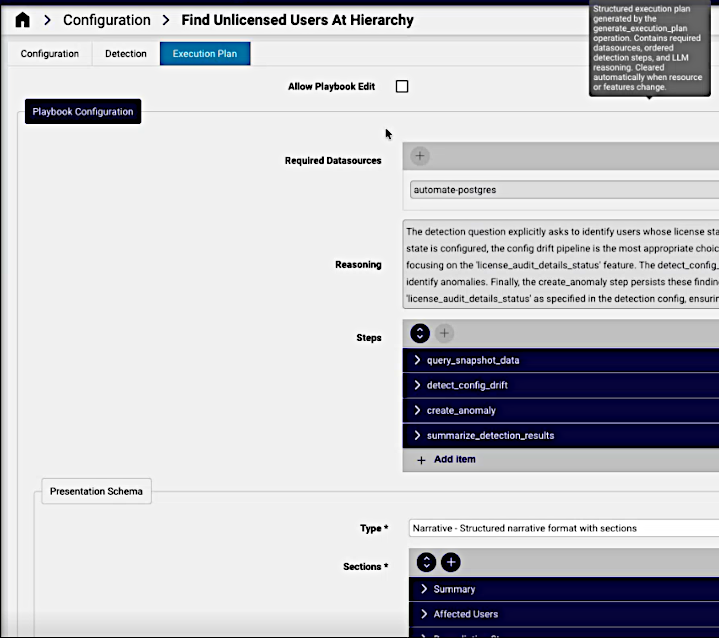
Required Datasources: data sources identified for the plan
Reasoning: a generated motivation for the chosen detection approach.
Steps: the list of steps to be taken, which would include the selected detection algorithm.
Presentation Schema: what format reults will be presented
Type: Narrative or JSON
Sections: categories in the presentation, for example: header, description
Manual Configuration of Execution Plan#
TBD
Execute the Plan#
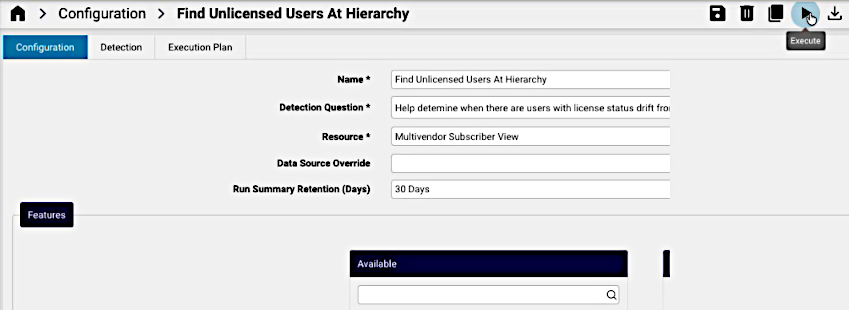
From the Configuration tab, the Execute menu option can be run.
Scheduling#
For continuous monitoring without manual intervention, configure scheduled execution. Schedules can be associated with the execution of this anomaly detection instance. Anomaly records from scheduled runs are stored and can be queried in the same way as on-demand results.
Execution runs and details#
The results of the execution are available from the Runs menu. The menu list view shows such details as the execution time, status and anomaly counts of instances.
A selected instance shows Run Details and Finding information, for example:
Detection Config: the name of the anomaly detection configuration
Started At: execution time of the run
Anomalies Created: a count of anomalies
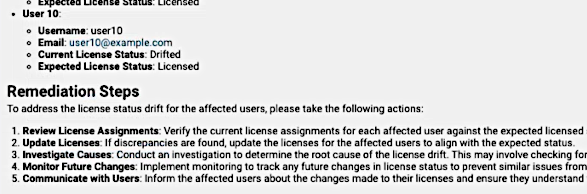
Findings provide categories for a summary, details and proposed Remediation Steps as in the example image below:
Reference#
Detection Algorithms#
Three distinct detection methods are available, each suited to a different class of problem.
Method |
Algorithm |
Best For |
|---|---|---|
|
Baseline comparison |
Detecting configuration changes from a golden state |
|
Isolation Forest |
Finding individual resources that are anomalous relative to their peer group |
|
Prophet |
Identifying unusual trends, spikes, or drops in time-series metrics |
Configuration Drift Detection#
Compares current device or resource configuration against a known-good baseline (golden state). Flags fields that have changed in unauthorized or unexpected ways.
Example question:
"Tell me when any admin configuration for the role changes from the desired state."
How it works:
Takes a snapshot of current configuration for resources in scope
Compares each field against the baseline snapshot
Flags deviations that exceed the configured severity threshold
Creates an anomaly record for each significant drift
Best for: Security compliance, change management, and auditing unauthorized modifications.
Population Outlier Detection#
Clusters resources into peer groups based on shared characteristics, then identifies resources that behave significantly differently from their cluster. This catches anomalies that global thresholds would miss - a configuration value might be normal globally, but unusual within a specific peer group.
Example question:
"Find meeting rooms with configuration that differs from their peer group."
How it works:
Gathers resource configuration or metric data
Uses Isolation Forest to cluster resources and score each for anomalousness
Surfaces resources that score above the contamination threshold
Creates anomaly records with the outlier score as the confidence factor
Best for: Fleet-wide health monitoring and identifying misconfigured individual resources.
Time-Series Anomaly Detection#
Analyzes time-series metrics over a configured lookback window to identify unusual trends, spikes, or drops. Uses the Prophet algorithm, which understands seasonality, so a spike at 3 AM on a Sunday is judged differently from the same value at 9 AM on a Monday.
Example question:
"Detect unusual patterns in call quality metrics."
How it works:
Queries historical metrics for the lookback period
Uses Prophet to establish baselines and detect seasonality (daily/weekly patterns)
Identifies values outside the expected range for that specific time period
Assesses context: correlated changes, affected users and sites
Creates anomaly records typed as
time_series_spikeortime_series_drop
Best for: Call quality monitoring (jitter, packet loss), license utilization trends, and gradual performance degradation.
Example Configuration#
name: "User Config Drift Detection"
hierarchy: "Provider"
detection_question: "Tell me when any admin configuration for the role changes from the desired state"
datasource: "User Admin"
detection_method: "config_drift_analysis"
baseline_snapshot_id: "golden-state-001"
severity_threshold: 0.7
playbook: "/api/data/AgentPlaybook/anomaly_config_drift"
Predefined Templates#
Pre-configured templates are available for common scenarios:
License utilization trends
User configuration drift detection
Resource outlier detection
Time-series metric anomalies
Pre-Built Playbooks#
Playbooks are JSON files that guide the AI agent through the detection process. Each playbook defines a sequence of goals and rationales for each step. You do not need to write detection logic from scratch.
Choose one of the pre-built playbooks or reference a custom one:
Playbook |
Path |
Detection Type |
|---|---|---|
Config Drift Detection |
|
|
Time-Series Anomaly Detection |
|
|
Config Drift Detection Playbook#
anomaly_config_drift/api/data/AgentPlaybook/anomaly_config_driftPurpose: Detects devices or resources with configuration that differs from their peer group, using ML clustering to discover natural peer groups automatically.
Activation example:
detection_question: "Find meeting rooms with configuration that differs from their peer group"
playbook: "/api/data/AgentPlaybook/anomaly_config_drift"
Execution steps:
Step |
Goal |
Rationale |
|---|---|---|
1 |
Query device configuration snapshots for scope |
Need current config state |
2 |
Cluster devices
by
configuration
similarity
( |
Identify peer groups |
3 |
Compare each device to its cluster centroid |
Find deviations |
4 |
Create anomaly
for significant
deviations
( |
Persist findings |
Anomaly fields produced:
Field |
Value |
|---|---|
|
|
|
Based on field importance and deviation magnitude |
|
LLM-generated explanation of what differs and by how much |
|
Deviation magnitude, cluster size, field importance |
Significance threshold: Fields that deviate more than 2 standard deviations from the peer median are flagged.
Tool dependencies:
ml_clustering(groups devices into natural peer groups)create_anomaly(persists detected anomalies)Existing data discovery tools
Playbook JSON:
{
    "playbook_id": "anomaly_config_drift",
    "name": "Config Drift Detection",
    "description": "Detect devices with configuration that differs from peer group",
    "applicability_criteria": ["anomaly_detection", "config_drift", "peer_comparison"],
    "required_datasources": ["device_config_snapshots"],
    "steps": [
        {"goal": "Query device configuration snapshots for scope", "rationale": "Need current config state"},
        {"goal": "Cluster devices by configuration similarity", "rationale": "Identify peer groups"},
        {"goal": "Compare each device to cluster centroid", "rationale": "Find deviations"},
        {"goal": "Create anomaly for significant deviations", "rationale": "Persist findings"}
    ]
}
Time-Series Anomaly Detection Playbook#
anomaly_time_series/api/data/AgentPlaybook/anomaly_time_seriesPurpose: Monitors call quality and performance metrics for unusual patterns, accounting for daily and weekly seasonality to avoid false positives.
Activation example:
detection_question: "Detect unusual patterns in call quality metrics"
playbook: "/api/data/AgentPlaybook/anomaly_time_series"
Execution steps:
Step |
Goal |
Rationale |
|---|---|---|
1 |
Query metrics for the configured lookback period |
Use existing query tools |
2 |
Analyze
patterns using
|
Call
|
3 |
Identify anomalies from analysis results |
Review anomalies array; consider trend direction for degradation |
4 |
Assess context and correlations |
Group anomalies by affected entity; note timing patterns |
5 |
Create anomaly
for significant
findings
( |
Use |
Supported metrics: Jitter, packet loss, call volume, sync runtime, and other time-series performance data.
Anomaly fields produced:
Field |
Value |
|---|---|
|
|
|
Based on deviation magnitude and impact |
|
LLM-generated explanation including baseline comparison |
|
Deviation sigma, sample size, persistence |
Seasonality handling:
Business hours vs. overnight patterns are distinguished
Weekly patterns (Monday vs. Sunday) are accounted for
Gradual degradation trends are detected, not just sudden spikes
Tool dependencies:
ml_time_series_analysis(establishes baselines; detects anomalies)create_anomaly(persists detected anomalies)Existing data query tools
Playbook JSON:
{
    "playbook_id": "anomaly_time_series",
    "name": "Time Series Anomaly Detection",
    "description": "Detect unusual patterns in time-series metrics",
    "applicability_criteria": ["call quality", "jitter spike", "packet loss", "performance degradation", "sync runtime"],
    "required_datasources": ["metrics_data"],
    "steps": [
        {"goal": "Query metrics for the configured lookback period", "rationale": "Use existing query tools"},
        {"goal": "Analyze patterns using ML time-series tool", "rationale": "Call ml_time_series_analysis for each metric"},
        {"goal": "Identify anomalies from analysis results", "rationale": "Review anomalies array, consider trend direction for degradation detection"},
        {"goal": "Assess context and correlations", "rationale": "Group anomalies by affected entity, note timing patterns"},
        {"goal": "Create anomaly for significant findings", "rationale": "Use create_anomaly tool"}
    ]
}
Error Reference#
Error Code |
Meaning |
Common Cause |
|---|---|---|
|
Invalid detection configuration |
Missing required fields or unsupported parameter values |
|
Cannot access data source |
Data source unavailable or insufficient permissions |
|
ML model execution failed |
Insufficient data for the algorithm, or data format mismatch |
|
LLM context window exceeded |
Dataset too large; apply filters to reduce scope |
|
Operation timed out |
Reduce |