Troubleshooting the Dashboard
Add Mongo as a Datasource on Dashboard server
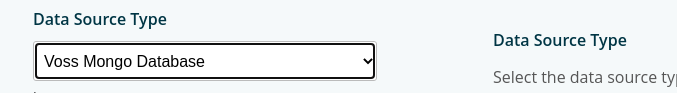
In some deployments when going to add VOSS Automate as a data source, in the drop down list Mongo will be missing.
To rectify this:
Log in to CLI as root
Run the following
cp -v /etc/lxt/voss4uc/Lxt/lxt-datasource-types/voss-mongo.lxt-datasource-type /var/www/api/Lxt/lxt-datasource-types/
Restart apache
sv restart apache
Now go back to the gui and check datasources, ensure you see Mongo Datasource in the list.
Arbstats dashboard Recovery
Log in to CLI as root
Run the following command
/usr/share/bin/runsv_kill.sh zoom_check
Broken Arbitrator stats fix
Usually if it isn’t working when you run ps axfw, you will see this process stuck:
/var/www/api/zoom/zoom_check.php
/var/www/api/zoom/configs/LXT_Stats_AnalytiX.json
Log in to CLI as root
Run:
rm -f /var/www/api/lxt_api_staging/datasource/NCF09REOSJTKVN0T1556654742966FPPHHMCNC1W7DP.lxt-datasource
rm -f /var/www/api/datasource/NCF09REOSJTKVN0T1556654742966FPPHHMCNC1W7DP.lxt-datasource

/usr/share/bin/runsv_kill.sh zoom_check
So, we are just removing the data source if it is there and then killing the stuck zoom process
You can manually try to run it with:
/var/www/api/zoom/zoom_check.php
/var/www/api/zoom/configs/LXT_Stats_AnalytiX.json
That will kick off the arbitrator stats collection manually.
The system Index file is corrupted
System Impact – Critical
About the system Index file
The Index file in the Dashboard/Reporting server is the main text file that contains all logs forwarded from Correlation servers and logs sent directly to the system listeners (Netflow). It is the main archive of raw log data, and rotates as it archives from a “hot bucket” to a “cold bucket” The current Index that is being written in the system is the “hot bucket”, while archived Indexes are “cold” and no longer actively being appended. The Index file that is affected in the problem description is the current “hot” or active Index file.
How the Index becomes corrupted
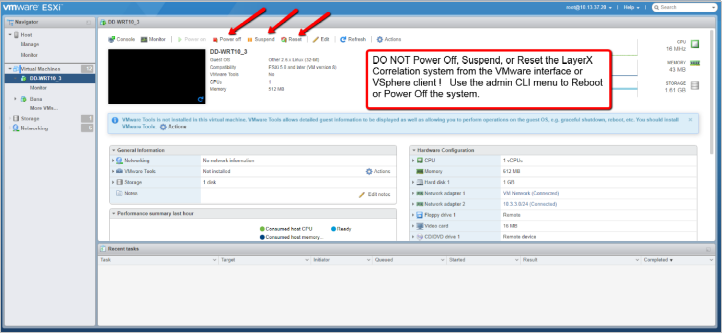
The Index becomes corrupted when either the Virtual Machine is improperly shut down in the VMWare management interface, or the VMWare host has an issue that removes CPU or disk resources from the system while it is writing to the file.
Do NOT Power Off, Suspend, or Reset the VOSS Correlation system from the VMWare management interface!
How to properly reboot or power off the system
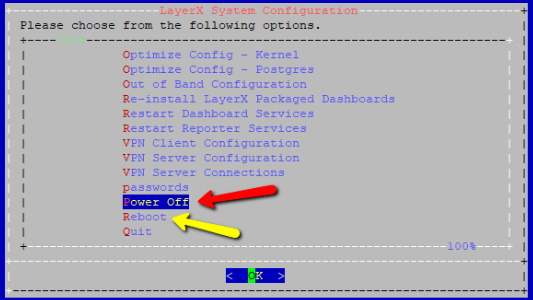
To properly power off or reboot the Dashboard/Reporting system, ssh to the system and login as the “admin” user to access the admin CLI menu.
From the Main Menu, use the arrow keys to navigate down to the Power Off and Reboot menu options. These operations will properly stop the system services and close the Index file so that it does not become corrupted when rebooting or shutting down the system.
Symptoms of a corrupted Index
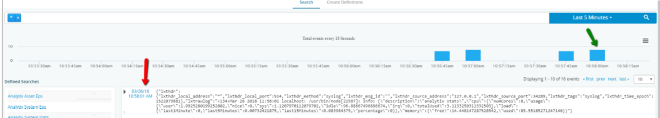
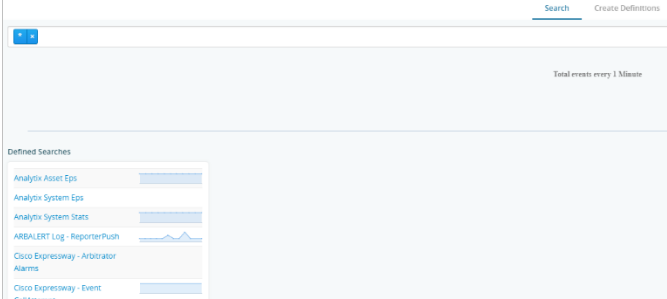
If the index is corrupted no new data can be written into the system. From the Dashboard Server GUI use the Search interface to look at the Index . When the index is corrupted the Search interface will return no data and look blank since the corrupted index cannot be read or accessed.
Side effects of a corrupted Index are no Search definitions will match data during the time frame that the Index is corrupted. This means there will be gaps in Dashboard data for widgets that utilize those Search definitions.
Example of a blank Search screen as a result of a corrupted index:
How to repair a corrupted Index file and restore operation
To properly repair the Index in the Dashboard/Reporting system, ssh to the system and login as the “admin” user to access the admin CLI menu.
Use the arrow keys to navigate to the Fix Corrupt Ndx menu option. Confirm the prompt to proceed.
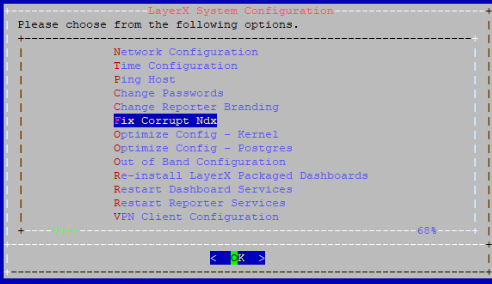
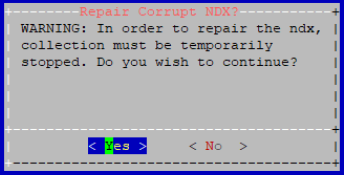
The system will indicate that services are stopping and the index repair is proceeding. Upon completion it will return to the admin menu.
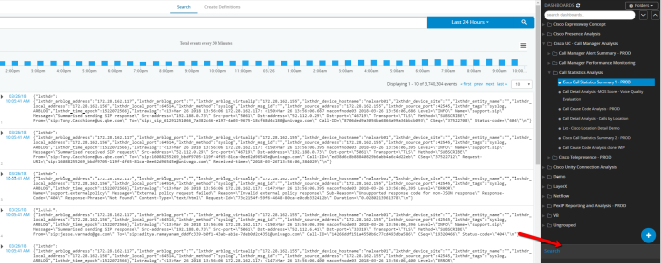
Use the Search interface in the GUI to validate that new logs are being written into the new Index “hot” bucket. The blue graph at the top of the Search interface is an indicator of log events being written into the Index in that time frame.
Drop Tables to free up Disk
Find the tables with the biggest in size
/usr/share/bin/dbTableSizes.v2.sh
This will display largest tables at the top. Take note of the name and the date in the table name. When you are ready to drop some tables, run the following command:
/usr/share/bin/dropTables.sh <Table name> <Table date - YYYY_MM>
This command simply prints the psql commands and the table names. It does not actually do any deletes yet. Confirm the list is what you want. If not adjust search and date accordingly.
Final command to commit delete is same command with
| psql ReporterServices.
Retrieve Dashboards
There isn’t a way from the UI but you can see the files on the backend.
Run
cd /var/www/api/dashboards
Here you will find a list of userids.
Run the following script to get the id of the user. Change “admin” to the userid of the person u want to see.
/usr/share/amfphp/services/lxt/bin/getLdapUser.php admin

a05818[...]
Then you can cd into
/var/www/api/dashboards/a05818[...]
You are now in the user dashboard directory.
Then you can run this to see all the dashboard names and guids. The guid is the same as the filename.
jq '{name:.name,guid:.guid}' *
This will print out something like this:
{
  "name": "Voss Customer Overview",
  "guid": "UFY1XV[...]"
}
Then copy the dashboards:
cp UFY1XV[...].lxtdashboard <destination>
Sync dashboards using CLI
If there are multiple users and dashboards sometimes this can have a detrimental effect on the dashboard server and cause Error 500 within the GUI when trying to sync dashboards to users.
A workaround is to identify the dashboards required and set up a script to sync them in the CLI
Create a PHP script at root in the CLI or copy ones from the files section and edit
#!/usr/bin/php
<?php

require_once("/usr/share/amfphp/services/Lxt/Lxt.php");
\Lxt\Lxt::registerAutoloader();
use \Lxt\Api\Model\LxtFieldConstants as LxtFieldConstants;
$model = new \Lxt\Api\Model\LxtDashboardGroupModel();
if ($argc > 1)
{
    $dusername = $argv[1];
}
else
{
    printf("Please provide destination user id\n");
    exit(1);
}
$directory = "/var/www/api/dashboard_groups";
$userid = trim(`/usr/share/amfphp/services/lxt/bin/getLdapUser.php admin`);
$dest_userid = trim(`/usr/share/amfphp/services/lxt/bin/getLdapUser.php $dusername`);
if (empty($dest_userid))
{
    printf("Unable to find userid: $dusername\n");
    exit(1);
}
$dg = array("A5A4R6YE74BRW08J1600705040082MI1SXXGPC7XDSU");   (Edit this line with the folder id that contains the dashboards to sync)
$allgroups = array();
foreach ($dg as $guid)
{
    $newgroup = new \stdclass();
    $newgroup->name = "";
    $newgroup->guid = $guid;
    $allgroups[] = $newgroup;
}
foreach ($dg as $guid)
{
    $groups = array();
    $groups = $model->getChildDashboardGroups($userid, $directory, $guid);
    foreach ($groups as $group)
    {
        $newgroup = new \stdclass();
        $newgroup->name = $group->name;
        $newgroup->guid = $group->guid;
        $allgroups[] = $newgroup;
    }
}
$model->syncGroups( $userid, $dest_userid, $directory, $allgroups, true, $error);
$model = null;
?>
To run the script in CLI
./scriptname_sync.php (username of the user to receive the dashboards)
Test mail from Dashboard
Log in to CLI
Run
echo "Subject: sendmail test" | sendmail -v Recipent email address
The local OpenLDAP service has stopped
System Impact – Minor
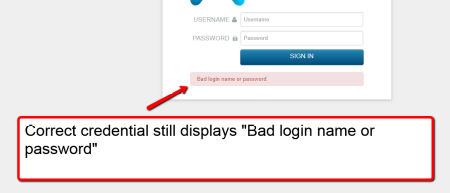
Symptoms of a down OpenLDAP service
Local administrative users are created and stored in the instance of OpenLDAP on the Dashboard/Reporting server. If the service is ever stopped, local users cannot authenticate to access the GUI. Users synchronized from a SAML or AD repository are also affected and will not be able to access the GUI.
The OpenLDAP service state does not affect normal system processing, so logging and alerting functions will continue.
How to restore local system authentication for the GUI
The system will need to be restarted from the admin CLI menu to resolve the OpenLDAP issue. Reference the “Corrupted Index” section at the top of this document for system reboot procedures.
The main service (Reporter) is DOWN
System Impact – Critical
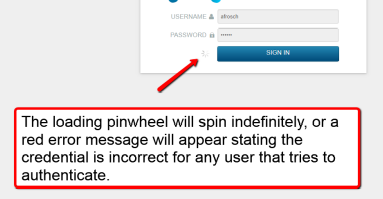
Symptoms of a down Reporter service
When the Reporter service is down, no new logs or events can be written to the Index. The Search interface will look responsive since the Index is not corrupted. Use the log time stamp to validate that new logs are not being written into the Index.
Other side effects of a stopped Reporter process
Data for Dashboards gathered from Search definitions using logs will have gaps for the time frame that the Reporter service is down
NetFlow data sent directly to the Dashboard/Reporting server will not be gathered in the time frame that the Reporter service is down.
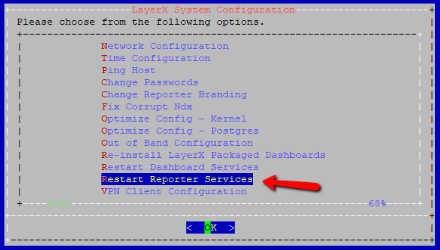
How to restart the Reporter service
To restart the Reporter process in the Dashboard/Reporting system, ssh to the system and login as the “admin” user to access the admin CLI menu. From the Main Menu select use the arrow keys to navigate to the Restart Reporter Services menu.
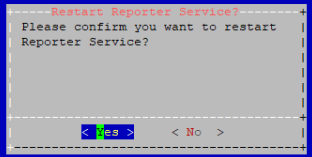
Select that option to restart the Reporter service. Confirm the operation. Upon completion of the operation the system will prompt the user to hit <Enter> to return to the menu.
Use the Search interface in the GUI to validate that new logs are being written into the Index by looking at the log time stamp. The blue graph at the top of the Search interface is an indicator of log events being written into the Index in that time frame.