Log Search Section
Click Main Menu ![]() and select the Search option toward the bottom
of the screen. The main search screen is launched into the default “Search” section.
The default display value is the last 10 log events to enter the system. As shown
below, the main search bar is located along the top of the screen with a blue
highlighted “*” wildcard to display logs.
and select the Search option toward the bottom
of the screen. The main search screen is launched into the default “Search” section.
The default display value is the last 10 log events to enter the system. As shown
below, the main search bar is located along the top of the screen with a blue
highlighted “*” wildcard to display logs.
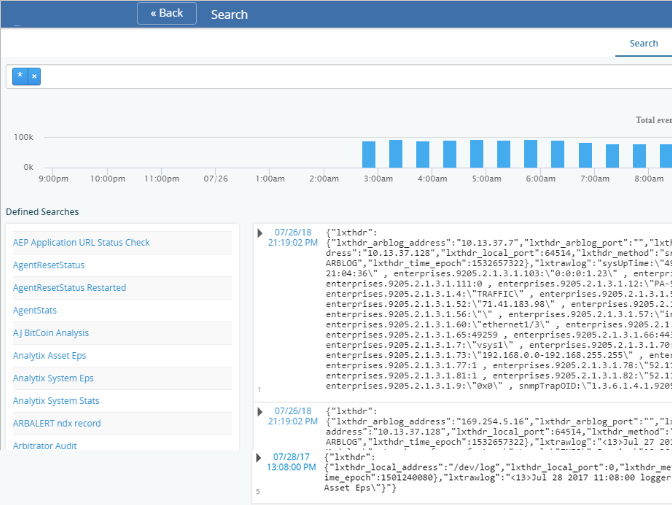
Once Logs are collecting this is where the JSON indexed records will be located. The system builds a library of all words contained in logs. The search bar allows for key word searches using single words or concatenated words with Boolean logic such as ‘and/or/not’ in addition to utilizing our automated Regular Expression engine to perform search extractions and save them as definitions. Additionally the search engine will start showing all words as soon as the first letters are typed thus making it easier to start the search process.
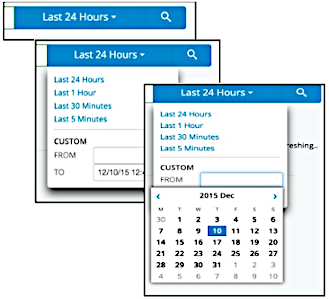
The drop-down box on the top right establishes the timeframe on which the system will search for logs. The default is the last 24 hours. Since log data (and the JSON indexed records) are time based the search timeframe is important. This is especially true when searching for logs from a source that has stopped sending data.
Clicking on this drop-down box opens up a date range box with preset time selections (Last 24 Hours, Last 1 Hour, Last 30 Minutes, Last 5 Minutes) along with a custom timeframe selection.
Clicking in the From box opens a calendar from which the timeframe can be selected. Be aware that the longer the date range, the more data the system searches thus the search timeframe is directly tied to the amount of data over time.
Just below the date bar is an entry that shows how many logs are available for the search request and timeframe along with how many are being displayed on the screen.
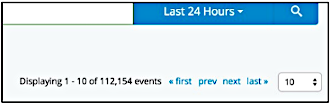
The commands beside this allow you to go to the beginning “< first”, go back to the previous groupings “prev”, skip to the next groupings “next” or forward to the last groupings “last”. The drop-down box to the right of this allows the selection of the number of logs to be displayed at once based on your search criteria.
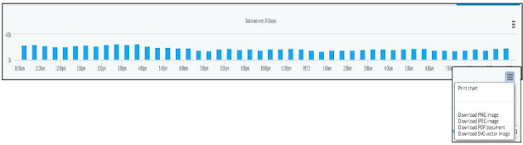
Just below the search bar is a bar graph that, by default, represents the last 24 hours of log events with each bar representing quantity of logs collected in each 30 minute interval.
To the top right of the graph there is a menu button, when selected, will provide the
option to retrieve the graph in multiple formats (print it to .pdf, download
to .png, download to .jpeg, download to .pdf or download to .svg).
This graph will change based on the selected data interval and based on the selected definitions
as described below.
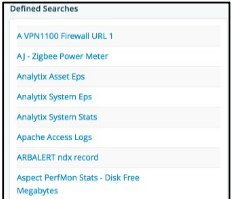
On the left side of the screen is a listing of all of the saved Search Defintions. A small graph will be present just to the right of each definition indicating the amount of logs in that definition over the time period selected in the time bar. By selecting any definition the logs will change and pull up all of the logs for that definition. Additionally the bar graph will adjust to reflect the quantities of logs in this definition.
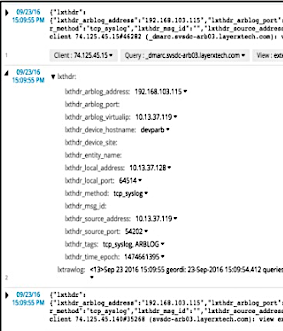
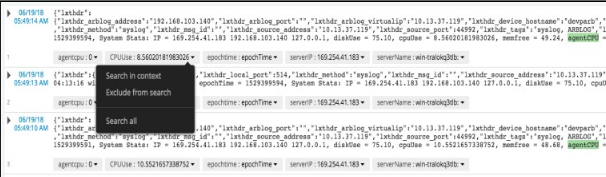
In the main body of the page you will see the JSON format of the logs associated with the selected search definition. Notice that below each log are the data fields that have been extracted and are being analyzed on dashboards. Additionally each field has a down facing arrow to it’s right. Clicking this arrow opens up a box and will provide search functions to select from:
Search in Context will search through all of the selected definition for that field and highlight it.
Exclude from Search will search through all of the selected definition for all data without that field.
Search All will search the entire log index data store for that field and highlight it.
To the left of the date and time within each log is a right facing arrow. Clicking this arrow will open up the log and break out all to components of the VOSS Insights logging elements along with a copy of the raw log. Each item also has a down facing arrow that when clicked will open up the same search box and capabilities as detailed above.