Building a Chart Overview
After you have the data elements defined for the widget then you can decide how to reflect the analysis. Just below the Configure Data section is a section defined as Build Chart.
Build Chart
Here you have several options to choose from based on the data type.
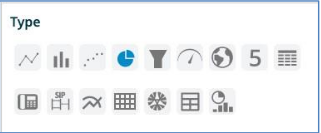
Type: There are 11 chart types exposed that can be utilized to display your data. (Line/Area Chart, Column/Bar Chart, Scatter Chart, Pie/Doughnut Chart, Funnel Chart, Gauge Chart, Card Chart, Table Chart, Call Hops and SIP Ladder Diagram.)
Each one has specific rules that apply to certain data elements. Example: Table data elements over time (i.e. DNS Entries for the day by IP address) will not display with a gauge type. Each chart type also will bring up specific options that can be utilized for that chart under the Settings section