
Building a Dashboard / Report
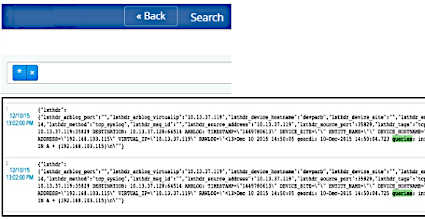
The first step in building an VOSS Insights Dashboard and Report is to decide which logs contain the data to analyze. An example is DNS Logs from a Bind9 open source DNS server. Simply type any word contained in these logs, such as “queries”, and then make sure that you have the log coming from the Bind9 DNS server.
Next, start your extractions of the fields you wish to analyze. Highlight the field by dragging the cursor over it or double clicking the field. A box will be drawn around it and a box will pop up to name the field.
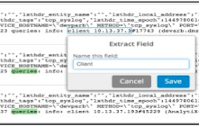
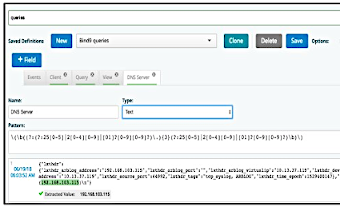
Type your field name (as shown above) and click Save. The automated Regular Expression engine will extract that field and save the name just below the saved definitions bar. Click the New tab to open it up and adjust the Type field based on the context of the log, for example: “Text”, “Integer”, “Float”, “Epoch Date” and “Calculation”.
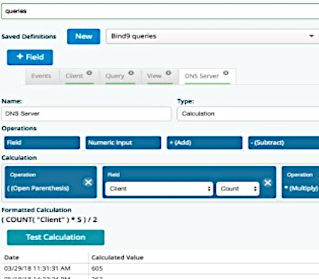
If “Calculation” is chosen in the type field, then the user is presented with an additional view where math can be performed to derive an integer result. An example of this is a bandwidth calculation. This particular result will be stored with the definition and will be available to utilize on a dashboard. Simply drag the field(s) to calculate, add a numeric input and then design the equation by dragging the operands and groupings. The equation will be displayed below the bar to allow for easy checking of the logic. By clicking the Test Calculation button, the system will perform the math and display the results for further logic testing ahead of saving the calculation.
Repeat this step for each field you wish to analyze.
Once complete be sure to give this search definition a name. Each search definition creates a default dashboard and report with the title being the name you gave the definition. (More on the dashboards to come.) Keep in mind that there is no limit to the number of combinations of saved search definitions allowed on any log source (i.e. multiple search definitions on a DNS log).
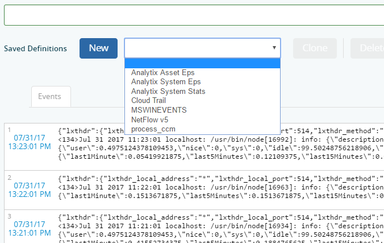
The Saved Definitions drop-down contains the complete list of all saved definitions that have been created. Each Saved Definition is now a Resource from which data can be pulled into a widget on a dashboard and report as you design them.
The buttons to the right, i.e. Clone, Save, Delete and Summarize Data allow the management of the search definitions/resources.

Clone allows you to take a saved definition and copy it. Simply pull up the definition you want and click the clone button and give it a new name. Now you can simply change only the field extractions you want instead of creating them from new.
Save allows you to save a modified search definition. Note that when a definition is modified and saved then the dashboard will start updating when new log data arrives into the system.
Delete allows you to delete a search definition from the list.
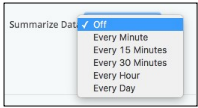
Summarize Data gives you the option of consolidating the data from the logs based on time. Clicking the drop-down, allows you to choose the required interval on which the data will be summarized (Minute, 15 Minutes, 30 Minutes, Hourly, and Daily). When invoking summarization all unique combinations of text fields will be kept.
Integer fields are aggregated together with their associated operation (Counts are summed; Min, Max, Avg, Stddev, and Variance aggregations are stored for every integer field). This is a method of making the dashboards more responsive since it will summarize the data and store only that one value versus all of the values.