Correlate
Menu Bar
There are distinct functional ‘Views’ within the interface. Each will be covered in its own section of this guide.
Policy Monitor
Asset Map Explorer
Asset Explorer
Alarm Analyzer
Event Search
Call Path Monitor
Call Detail Monitor
This menu is located at the top of the browser page and allows you to navigate to each of the Arbitrator views. Each are shown below:
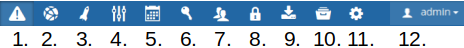
Policy Configuration
Asset Configuration
Probe Configuration
Controls
Response Procedures
Credentials
Customers
Access Control
Import / Export
Archive Management
Tools
Admin
Assets
Asset Map Explorer
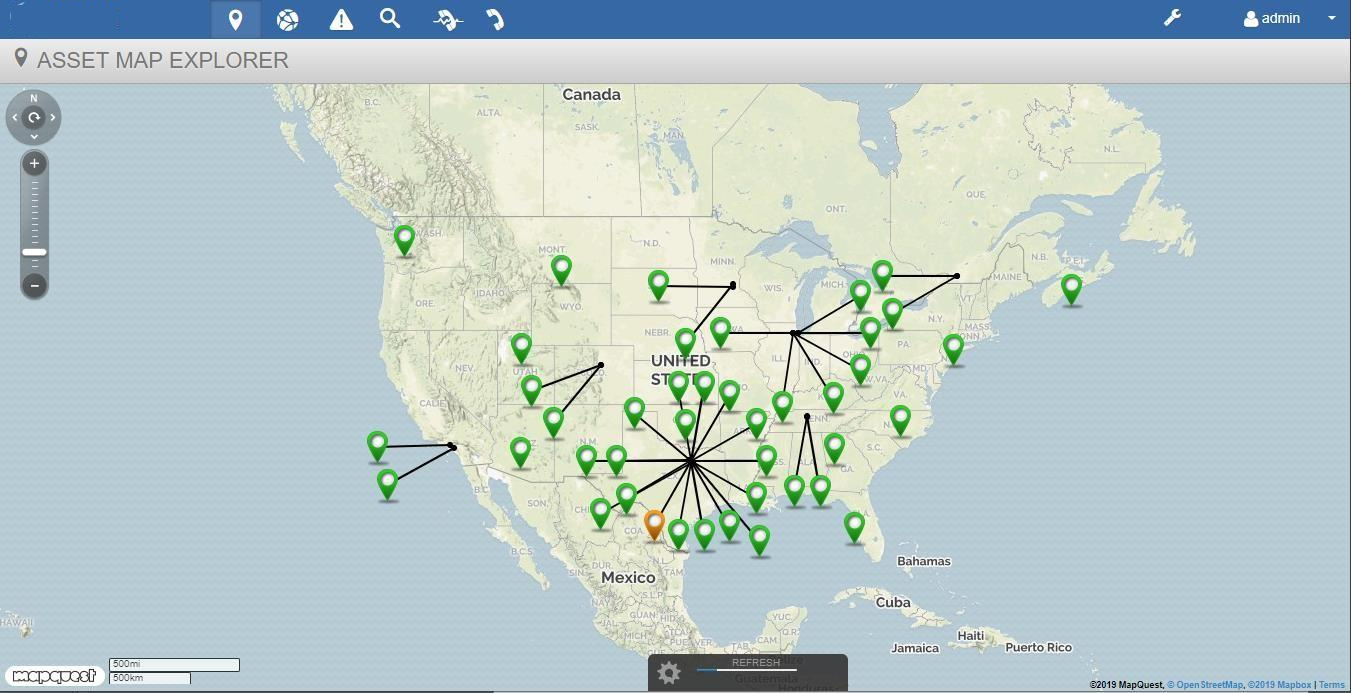
This view displays all of the defined assets in the system on a map for visual grouping according to their physical location. The location or address of the assets are input in the asset configuration section within the Configuration interface. This view is integrated with the MapQuest API (Internet access required to display the map).
Note: The system allows the ability to import a .csv file of assets and addresses.
Asset Overview
Each Asset is colored to reflect its current Alert Status. The status colors available and their meanings are below:
Red (Critical)
Orange (Major)
Yellow (Minor)
Blue (Informational / Notification)
Green (Healthy)
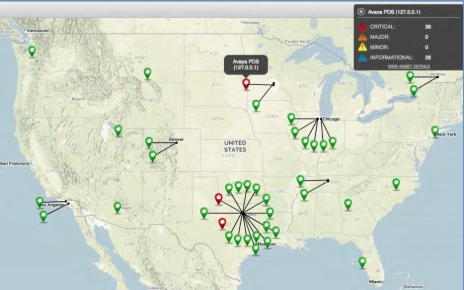
You can click on any of the assets to display the summarized alarm statistics for that asset. A box will open in the upper right corner of the screen to show the details. To see greater detail about the status of the asset, click on the underlined View Asset Details in the bottom of the box. This will take you to the Asset Details view. (See Asset Details view under the Asset Explorer Section)
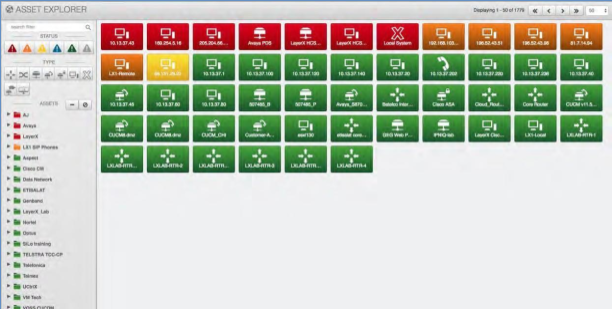
Asset Explorer
Asset Explorer gives a view into the current alarm state of the assets monitored by Arbitrator.
Only devices created as Assets in the Arbitrator system will be rendered in the view. Since Correlated events create alarms in the system, asset icon colors will change to reflect the severity level of the alert. Assets display the color of the current highest-level alert for that asset in the system.
Alert Severity Levels:
Red (Critical)
Orange (Major)
Yellow (Minor)
Blue (Informational / Notification)
Green (Healthy)
Asset Filtering
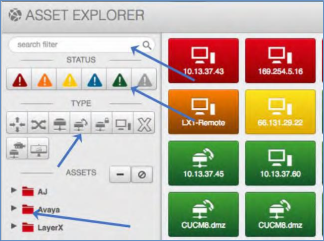
The Assets displayed can be filtered using the filtering pane on the left. This includes:
Filtering by Alert Severity levels
Asset Type
Defined Asset Groups
Keyword
Asset Explorer Navigation
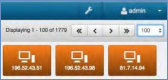
The Asset Explorer will display up to 100 assets per page. Use the navigation button in the top right to grab the next 100 assets or the specific increment you have set.
Asset Details View
The Asset Details View is opened when you double click on any of the assets in the Asset Explorer view. Once open the view contains 3 tabs:
Alerts
Probes
Search
Click Close in the upper right corner of the screen to return to the Asset Explorer view.
Asset Details: Alerts Tab
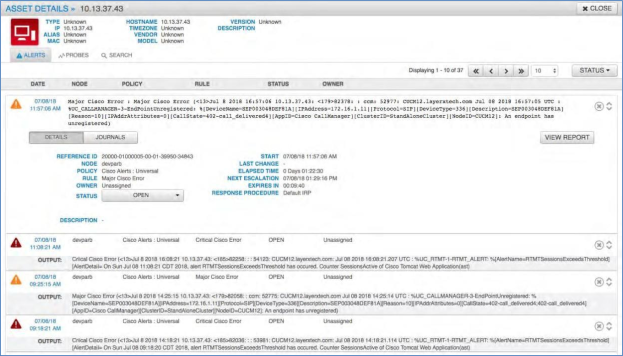
This tab displays all alerts associated with the asset and allows the user to disposition, add alert journal entries for the alert and see a report of the alert and events. (See Alert Disposition, Alert Journal and View Report within the Alert Analyzer Section)
Asset Details: Probes
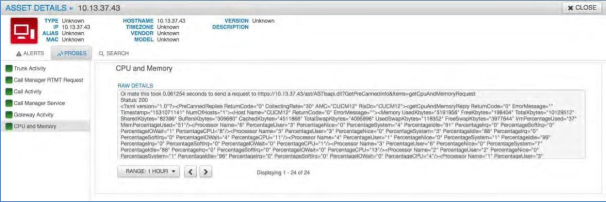
This tab displays all probes associated with the asset. Clicking on each probe will display the probes output. If output is a numerical value, such as CPU usage, then a graph will be displayed of that value over time. If the probe output is non-numerical then just the last probe output will be displayed.
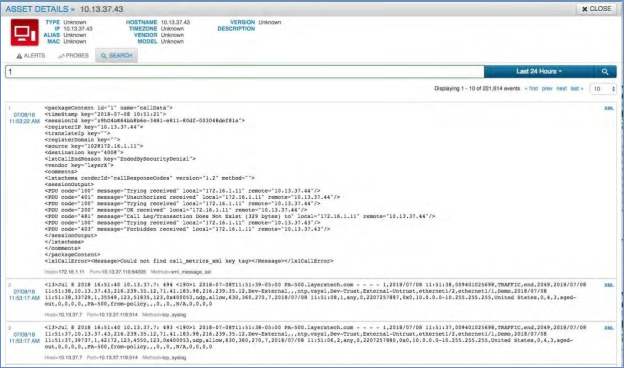
Asset Details: Search
This tab contains an event search bar tied to the data only associated with this asset. This allows the user to search all logs / events by this particular asset versus the entire index data store. (See Event Search for more details)
Alerts
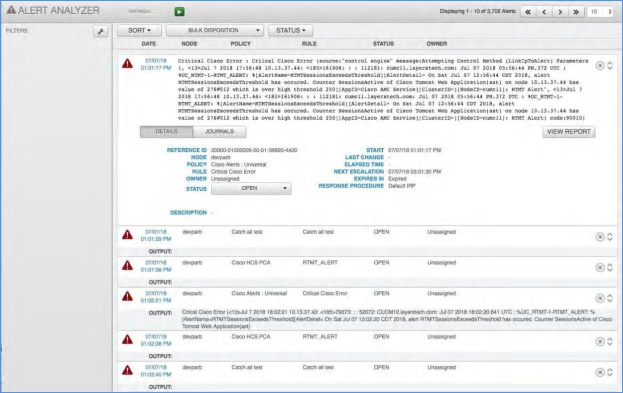
Alert Analyzer
The Alert Analyzer screen displays all of the alerts coming into the system based on a first in / last out presentation. It allows the user to see the alerts as they are happening or ones that have been in existence for a period of time. It also provides the ability to disposition the alerts based on activity as well as view a report with specific details associated with the alert. There are also several filter and sort options available to apply to the view.
Alert Disposition
The drop-down box allows you to set the status of each alert. The can be set one at a time or by bulk. The available options are:
Open: This is a new alert.
Under Review: Moved out of the open state and the alert journal can still be edited.
Acknowledge: Moved out of the open state and the alert journal can still be edited.
Release: Moved out of the open state and the alert journal can still be edited.
Close: Moved out of the open state and the alert journal can still be edited.
Disregard: The alert is deleted from the system.
Close and Locked: Moved to a closed state and the alert journal cannot be edited.
To disposition an alert simply open the alert by expanding it (click the up and down arrows to the far right of the alert). Once open select the drop-down box next to “Status” and select the disposition state.
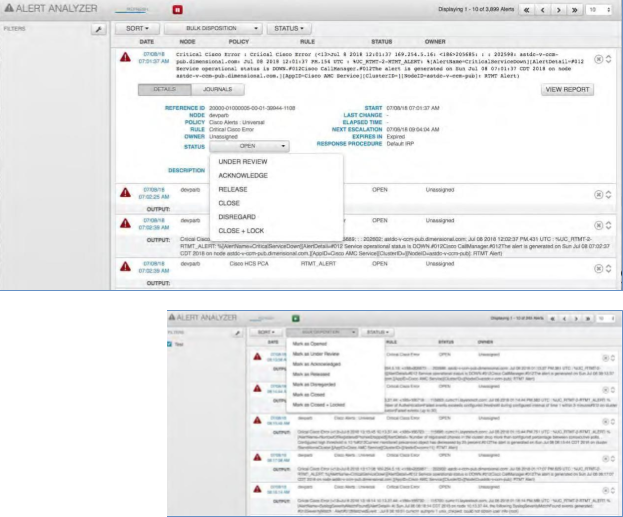
Bulk Disposition: This will allow the user to disposition a group of alerts at once. First apply the required filter to the alerts by using the Filter Manager (See Alert Filters). Once you have the group of alerts filtered then select the desired disposition state from the “Bulk Disposition” drop-down box.
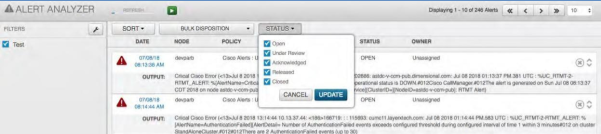
Filtering by Disposition
By clicking the drop-down box “Status” you can choose to see only the alerts with a specific disposition status. Once open select your choice(s) by checking the boxes and click update. The screen will show only the ones you have selected.
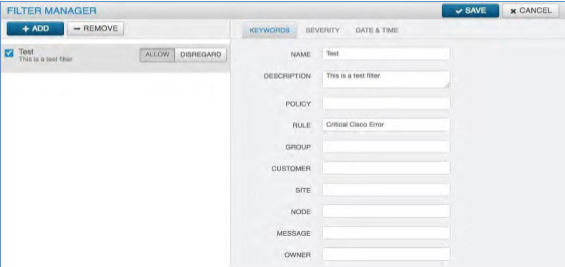
Alert Filters
Alert Filters provide the ability to filter all of the alerts by Keywords, Severity and Date & Time. Open the “Filter Manager” by selecting the wrench icon in the top left of the screen next to the word Filters. Click the “Add” button to add a new filter.
Keywords: Fill in the detail to filter by. Choose to enter one, many or all of the criteria fields.
Name: Sets the name of the filter for your reference
Description: Description of the filter
Policy: Filter by the name of the correlation policy
Rule: Filter by the name of the correlation rule
Group: Filter by the name of the group
Customer: Filter by the name of the customer
Site: Filter by the site
Node: Filter by the node
Message: Filter by the message
Owner: Filter by the owner
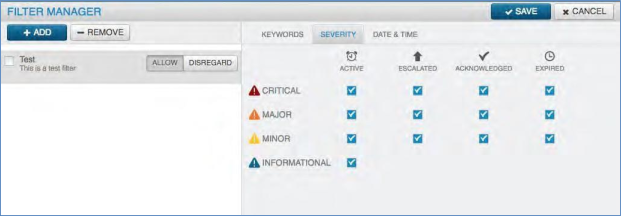
Severity: The filter can be set based on the chosen severity or severities. Additionally, the state or states can be chosen with each severity. Click the levels desired.
Active: Alert is currently in one of the active states
Escalated: Alert has been escalated based on the timer in the correlation rule
Acknowledged: Alert is in an acknowledged disposition state.
Expired: Alert has expired based on the timer set in the correlation rule
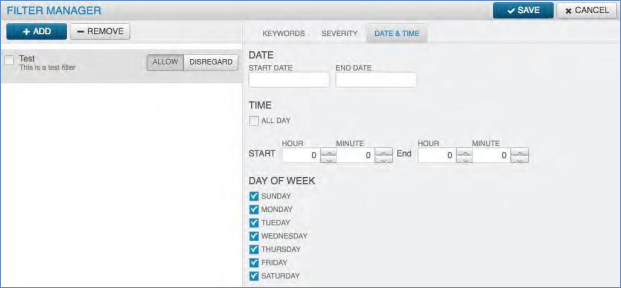
Date & Time: The filter can be set based on a date range, by “All Day”, by a specific start and end time, by the day of the week or any combination.
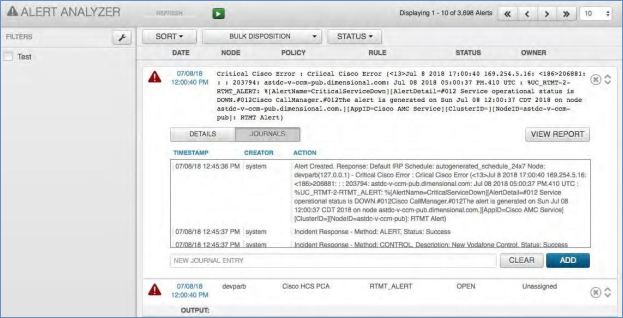
Alert Journal
The Alert Journal will show the history of the alert and the actions taken both by the system and by the user. Additionally, a user can add a journal entry to update status or actions taken.
To add an Alert Journal:
Click the Pause button to stop the automatic refresh
Expand the Alert you want to add an entry to by clicking the expand icon
Click the Journals Button
Type the journal entry into the text box where it says NEW JOURNAL ENTRY
When done Click Add
Click the Play button to stop the pause and allow to refresh
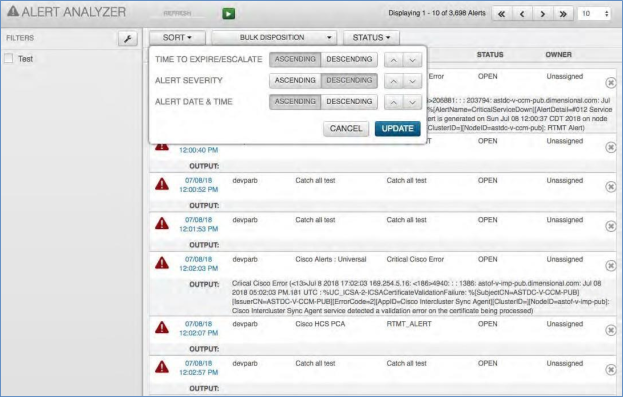
Alert Sorting
The alerts shown on the Alert Analyzer can be sorted based on three categories:
Time to Expire / Escalate
Alert Severity
Alert Date & Time
These three choices determine the sorting of the alerts on the Alert Analyzer screen. Each one can be toggled between ascending and descending order. Additionally, the order of each one will be the first to last in priority. This can be changed by clicking the down or up button next to each category.
Search
Event Search
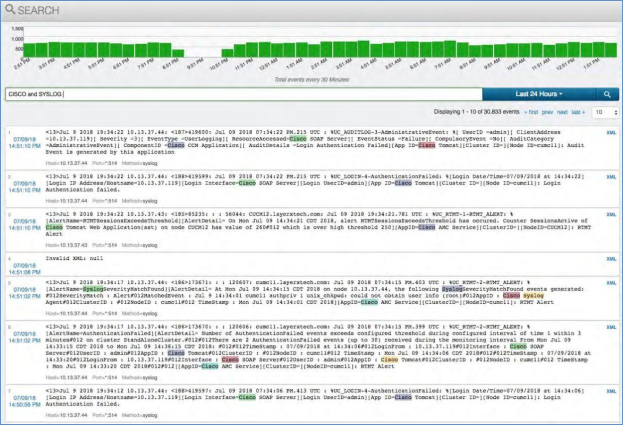
The Event search view provides access to all the raw data coming into Arbitrator Correlation and provides a simple interface to search and display it. The Arbitrator Correlation platform builds a dictionary of all of the words it has absorbed from all of the logs it has received and enables rapid search across large volumes of data. Essentially making an otherwise difficult amount of data quickly searchable and more useable.
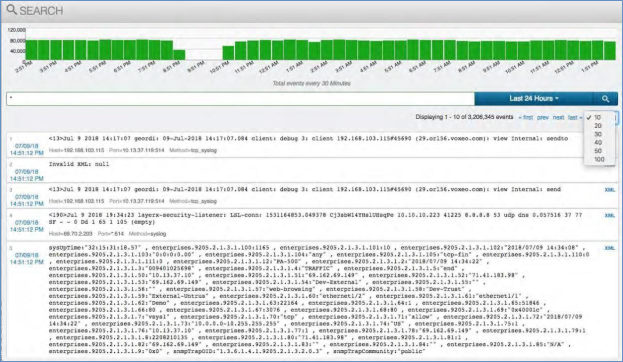
Simple Searching
To perform a simple search across all of the logs based on the default time of “Last 24 Hours” use the “*” wildcard character.
In the search text input field type *
Press Enter or click the magnifying glass icon
All log data received in the last 24 hours will be returned. The default number of logs per page is 10 but can be expanded by opening the drop-down box under the time bar and selecting the number desired.
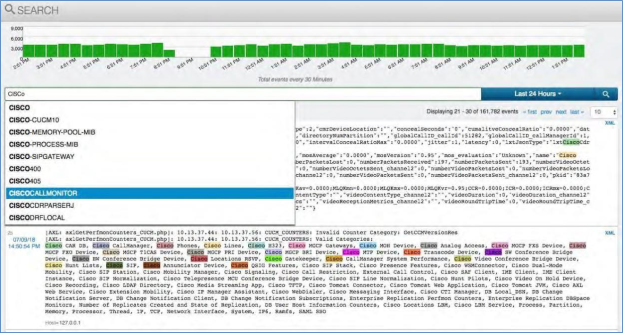
Keyword Searching
To perform a keyword search across all of the logs based on the default time of “Last 24 Hours” start by typing in the word that you know is present in your data, such as “Cisco”. As you type the word the event search will begin to auto suggest your keyword based on the data the Correlation platform has collected. Once you have finished press enter, select the word in the drop-down list or click the magnifying glass icon.
All log data that contains the keyword in the last 24 hours will be returned. The default number of logs per page is 10 but can be expanded by opening the drop-down box under the time bar and selecting the number desired.
Utilizing Conjunctions with Searching
The Event Search allows the use of conjunctions to combine keywords which will assist you in being more specific in your search. The conjunctions available are AND, OR and NOT. To perform a search with conjunctions across all of the logs based on the default time of “Last 24 Hours” start by typing in the word that you know is present in your data, such as “Cisco”, followed by the conjunction then the next word. Once you have finished press enter, select the word in the drop-down list or click the magnifying glass icon.
All log data that contains the keywords in the last 24 hours will be returned. Note: when using a conjunction in the search the logic must match or no data will be returned. The default number of logs per page is 10 but can be expanded by opening the drop-down box under the time bar and selecting the number desired.
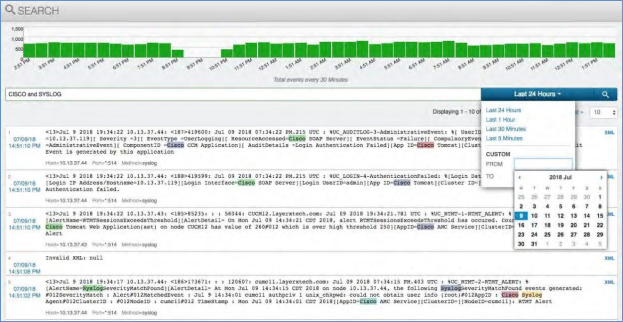
Date Range Searching
With any of the above methods the user can also select the specific date to search for the data. The default is the last 24 hours but by opening the drop-down bar several options are presented.
Last 24 Hours: The default
Last 1 Hour
Last 30 Minutes
Last 5 Minutes
Custom date range showing from and to. Clicking in the “From” box opens up a calendar from where you can select the specific from date you desire. Clicking in the “To” box will do the same.
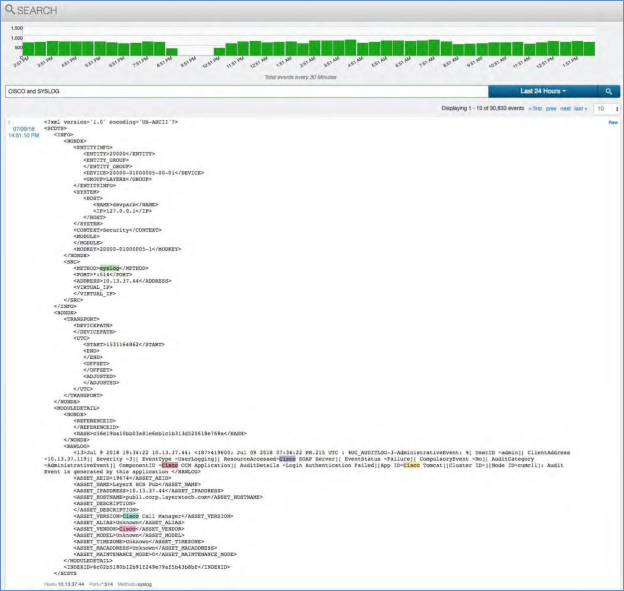
Search Result Meta-Data
The Event Search engine utilizes the core processes of the Arbitrator Correlation platform to store, tag and manage the data. To the right of each log entry is a blue “XML”. Clicking on this will open up all of the XML representation of the data along with some very important added elements. In particular are the Entity ID’s which server as the basis for making every event unique and formulating the “Reference ID” seen in the Alert Analyzer screen. Additionally, if applicable, a hash of the raw log is available for compliance purposes. To go back to the main search screen simply click the blue “Raw”.
Call Path
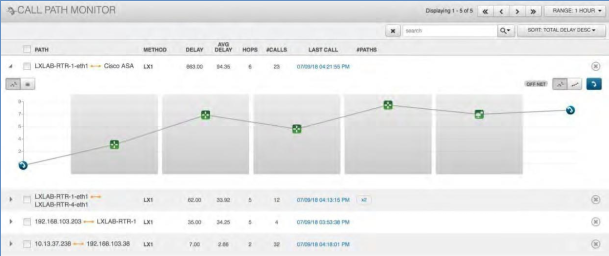
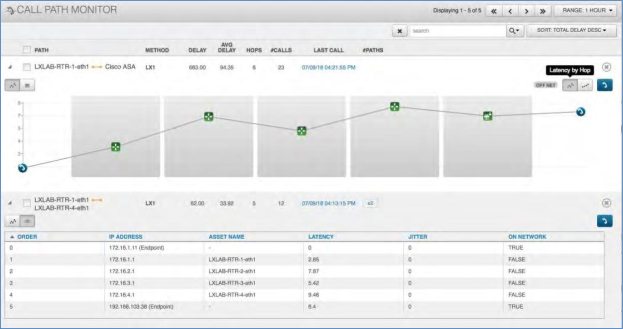
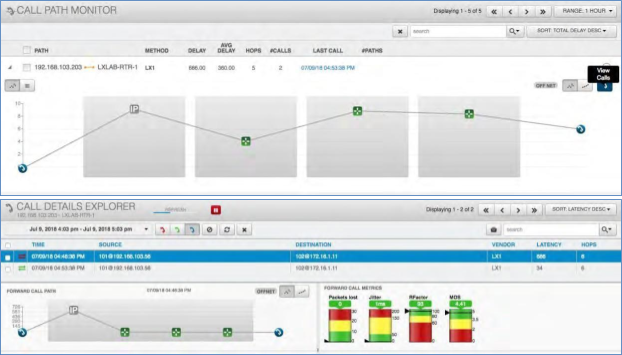
Call Path Monitor
The Call Path Monitor serves as one of the base screens for managing Unified Communications and the particular call path that a Voice over IP call takes. It will display the paths or routes that a call took from the source to the destination. Each path contains the IP Addresses, number of hops, delay and latency during the call.
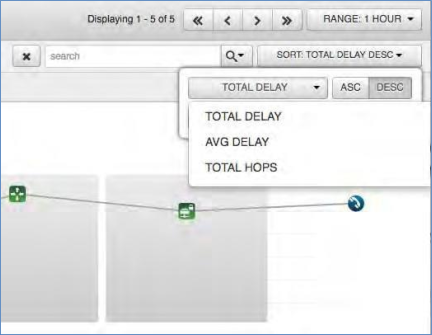
Sorting Call Paths
The screen and the represented call paths can be sorted by three variables:
Total Delay: The total latency on the call.
Average Delay: The average latency on the call.
Total Hops: The total number of layer-3 hops the call took.
Each selection also has the choice of selecting ascending or descending order.
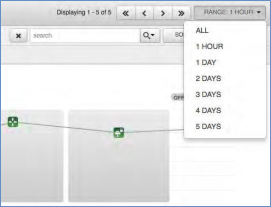
Time Range for Call Paths
This provides the option of selecting the time range in which to show the call paths collected. Click the “Range” drop-down button. The available options are:
All
1 Day
2 Days
3 Days
4 Days
5 Days
Expanding Call Paths
Expanding a call path allows you to see the path by hop or by IP Address. In addition, it provides an option to view it by the total per hop or cumulative delay, latency, and Jitter. The expanded view also shows you whether the call was ON Network or OFF Network. The expanded view can be toggled to show in graph or table views.
To expand a call path and toggle between graph and table views:
Click arrow icon next to the call path you want to expand
By default, the view will be in graph mode. To switch to the table view, simply choose the table view icon in the upper left corner of the now expanded call path.
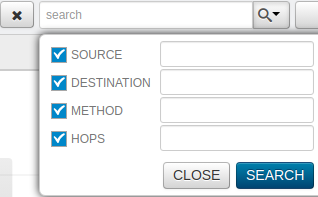
Searching Call Paths
Each Call Path has several fields you can utilize to search and filter for the call(s) that you are interested in. The fields available are:
Source
Destination
Method
Hops
View Call Details from the Call Path
The Call Path screen allows you to drill into the specific call details right on the chart. Simply click the blue telephone icon at the end of the path and it will take you to the Call Details Explorer view for that call path.
Call Details
Call Details Explorer
The Call Details Explores is the main screen for managing Unified Communications and the details of a particular call path that a Voice over IP call takes. It will display the time, source destination, vendor, latency and hops along the top screen. Below will show the Call path with each hop along with the call metrics (packets lost, jitter, R-Factor and MOS).
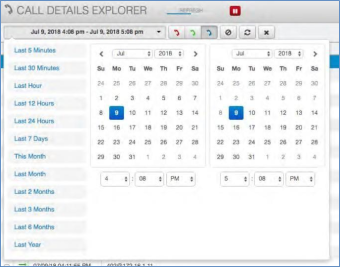
Filter by Date and Time
In the upper left corner there is a time bar. You can choose to search the call details by the various options presented. When you click inside the bar several options along with a calendar open up to select.
Last 5 Minutes
Last 30 Minutes
Last Hour
Last 12 Hours
Last 24 Hours
Last 7 Days * This Month
Last Month
Last 2 Months
Last 3 Months
Last 6 Months
Last Year
Specific Date and Time
Filter by Call Quality
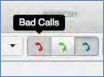
Just next to the time bar are several icons that allow you to filter the call detail data by Call Quality. There are 3 options:
Bad Calls (Red)
Good Calls (Green)
Bad and Good Calls (Blue)
Clear Filter, Update and Delete Call
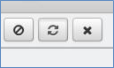
The three icons next to the call quality filters provide the functions below:
Clear Filter: This will remove all filters set and the call details will show the default display.
Update: The screen is pre-set with a refresh timer. Clicking this icon allows you to request new data on demand.
Delete Call: If the check box is selected next to any call then by clicking this icon the system will delete that call.
Refresh Pause
Selecting the pause icon in the top left of the view will stop the refresh cycle. This comes in handy as you are reviewing a specific call.

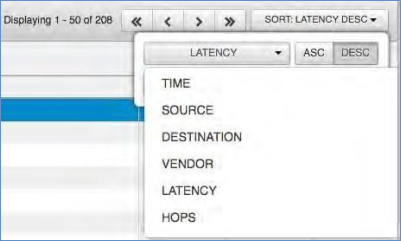
Sorting
At the top right of the screen is a drop-down button called “Sort”. Clicking this button will open up several options for which the call details can be sorted.
Time: The time the call was placed
Source: The source that placed the call
Destination: The destination of the call
Vendor: Identifies the method that created the call. The only options are LX1 (the VOSS Raptor Call Path generator) and RTCP (Avaya specific RTCP and call path data)
Latency: The aggregate latency recorded on the call
Hops: The total number of hops the call took
Each option allows for the choice of ascending or descending order.
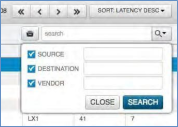
Search Call Details
The search bar in the top right of the screen allows the user to search for specific call details. There are three options that can be utilized to search:
Source: The source IP that made the call
Destination: The destination IP that received the call
Vendor: Identifies the method that created the call. The only options are LX1 (the VOSS Raptor Call Path generator) and RTCP (Avaya specific RTCP and call path data)
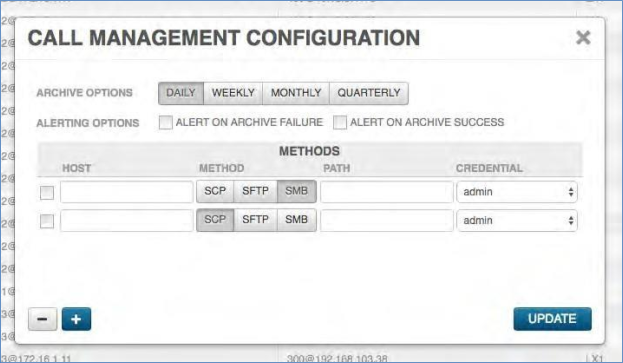
Call Management Configuration
In very busy or large environments it is imperative to manage the data that is being collected in the Call Detail Explorer. Have potentially 100’s of thousands of calls can lead to the data becoming difficult to manage. As such there is the option to manage the configuration of the call table within the Call Detail Explorer screen. Click the file cabinet icon next to the search bar and a menu screen will pop up. This provides optional time and methods for which the call data can be archived. The choices are Daily, Weekly, Monthly or Quarterly. Be sure to toggle on “Alert on Archive Failure” and “Alert on Archive Success. The methods available for archival are SCP, SFTP or SMB. Each requires a host, path and credential. Multiple methods may be added.