Build Chart in Widget Editor
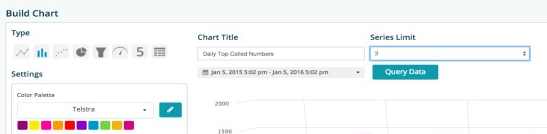
Chart Title
Once you have finished designing your widget you can give it a title. In the text box below Chart Title, enter the specific name you want to represent the data in the Widget. This name will be at the top of the widget on the dashboard.
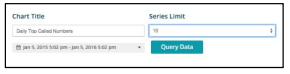
Series Limit
Next select the number of data points that need to be reflected in the chart.
This is an upper limit thus the chart will not reflect more than selected here.
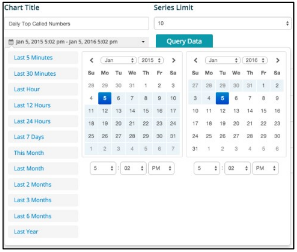
Timeframe
Next select the time frame by clicking on the data box just below the Chart Title.
A box will pop up showing a preset list of time frames.
If desired select one of these, i.e. This Month, otherwise a custom date and time frame can be selected by choosing the day/month/year/time in the left hand from calendar and the same in the right hand to calendar.
Query Data
By clicking this button the system will query the data based on your inputs and return a chart to inspect.
The chart will auto update its preview chart upon any field changes.
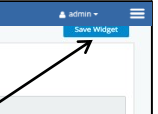
Save Widget
The Save Widget button is located in the top-right corner of the screen.
Make sure that you click this button before exiting the widget editor. If you don’t click this button, changes will not be saved.
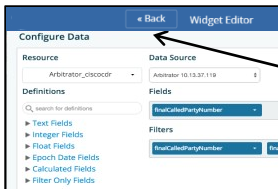
Back
The Back button is located in the top-left corner of the screen. Clicking this button returns you to the dashboard associated with that widget.