
Reports
Open the Main Menu and select the Reports option toward the bottom of the screen. This will open a page that will provide many powerful options to schedule and arrange your dashboards into reports.
This allows you to schedule and arrange your dashboards into reports as follows:
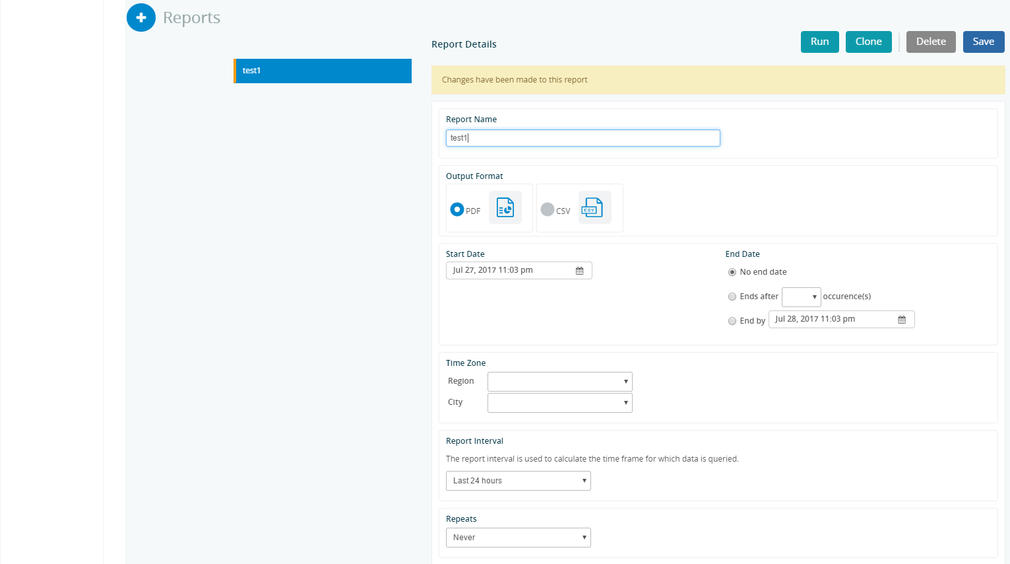
Click + Reports in the top left corner to add a report.
In the Report Name window give your report a customized name.
Select the start date using the calendar window.
Select the ending criteria for your report under End Date.
Select the time zone in the windows under the Time Zone label. Note: We utilize a city library that represents the majority of time zone locations thus your particular city may not be present but choose one that represents the time zone you desire, i.e. Chicago for Central Standard Time.
Select the report interval. This is the timeframe over which the data that comprises your report will be queried, for example, Last 12 hours.
Select how often you want the report to be repeated utilizing all of the options under the Repeats section.
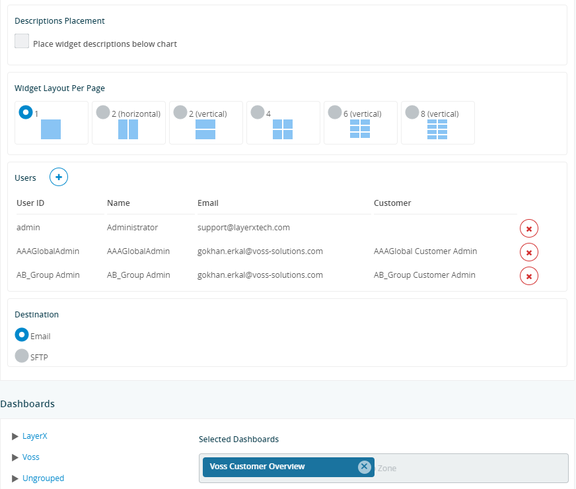
Click the add button next to Recipients and enter all of the email addresses of the individuals you wish to receive the report(s).
Non-admin users can also add other users to reports.
Click to add a cover page logo if desired. This will open a window that will allow you to select a logo file to include.
Select the option on where you want the descriptions to be located on the report. Selecting places the descriptions below the charts.
Select how many widgets to print on a page plus the output as either PDF or CSV.
Add the email addresses for the report recipients.
Under the Dashboards section drag and drop all of the desired dashboards that you want as reports.
Use the text editor below the dashboard list to design a summary page (including images) that will be placed at the top of the report.
Click Save at the top of the screen.
The buttons at the top of the report page allow you to Run the report, Clone the report so modifications can be made (i.e. new recipients in different timezones) and to Delete a report. The user has the option of outputting the reports in:
.pdfformatsaving them as
.csvto a destinationoutputting the data via JSON format.
output Excel workbooks (
.xls) creating a new tab for each widget inside a single excel workbook file.
The reports can be sent via email or via sftp to a host destination.