Call Hop Charts
When clicking on the Call Hop Chart the Settings options below are adjusted to that particular selection. This chart option creates a view where all the individual hops of the call are visible along with each hop latency.
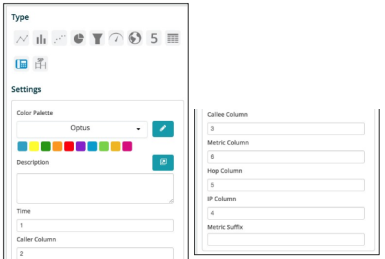
Color Palette - The color palette can be utilized to design specific highlight colors based on the amount of latency on each hop. For example: If a hop is over 200ms of latency that value on that hop can be colored red. The color palette is a choice for the user.
Description - A complete description of what this chart and widget represents can be typed in this box. This description will show up when you click the “i” in the top right corner of the widget.
Call Displaying Type - There are two choices. Call Hops utilized for Skype for Business and Call Paths utilized for Avaya RTCP.
The boxes just under the description are auto created based on the fields dragged out on the “Fields” bar. The numbers can be changed to represent the position that each of these fields show in the Call Hop chart. The last box Metric Suffix allows you to enter the metric measurement that the latency is presented in, i.e. ms for milliseconds.