Schedule Reports#
Overview#
The Report Scheduler allows you to schedule each report based on customer, duration, repeat time-frame, and email address.
You can access the reports functionality via the System Configuration menu (Cog icon) on the toolbar, then select Schedule Reports.
You can select two tabs on this page:
Configure
Display
Configure Tab#
On the Configure tab you can trigger a schedule, run a report, delete a report, or clone (copy) a report.
Note
Cloning allows you to create a copy that you can customize to add new recipients or a different time zone, for example.
On this tab you can also scheduling and arrange dashboards into reports.
The table describes options for working with reports:
Plus icon (+) |
Click the Plus icon (+) at Reports to add a new report. |
Run |
To run a report manually, select the report, then click Run. In the Print dialog that displays, choose a date for the report, and click Print to run the query and generate the report. You can view the progress and details of the query as it runs, and when it’s done, click Download to download the report so you can save it locally or to a network location. |
Clone |
To clone a report, select the relevant report, then click Clone. This allows you to create a new report based on settings in the cloned report. |
Trigger Schedule |
To manually trigger the schedule for a scheduled report, select the report, then click Trigger Schedule. For reports executed via a schedule, the system writes the report log details to the database (to the lxt_perf_data table). Event data display in a Dashboard widget ( lxt_perf_data widget), where you can view progress and print the details. |
Related Topics
Schedule and Arrange Dashboards into Reports#
This procedure sets up reports.
Prerequisites:
In Access Controls, add users who may receive emailed reports, along with their email address. See Access Controls
For emailed reports, if you need to set up an alternative IP address that will allow recipients to access the Dashboard to view reports in the Dashboard system via an IP address in the email notification sent to them:
Go to System Configuration > Configuration.
On the Sendmail tab, in the optional sendmail_from_host field, add an IP address to use as the URL for all emails that the system generates.
See Configuration
To schedule and arrange dashboards into reports:
Go to System Configuration > Scheduled Reports.
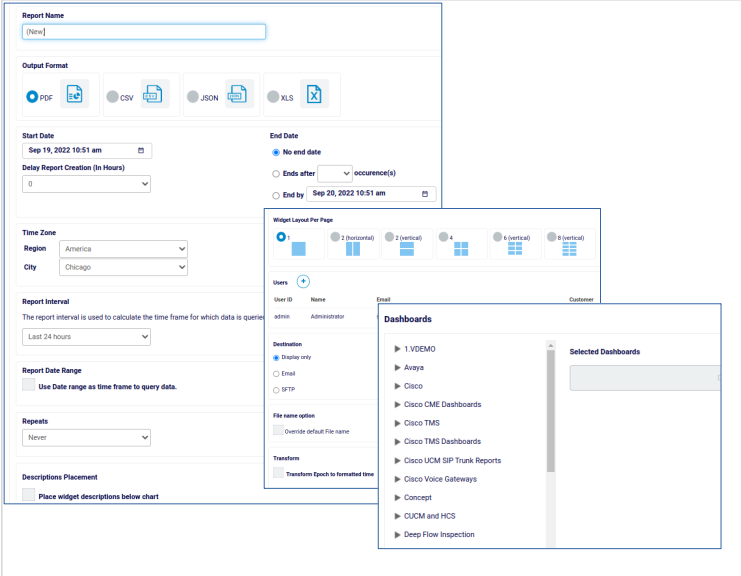
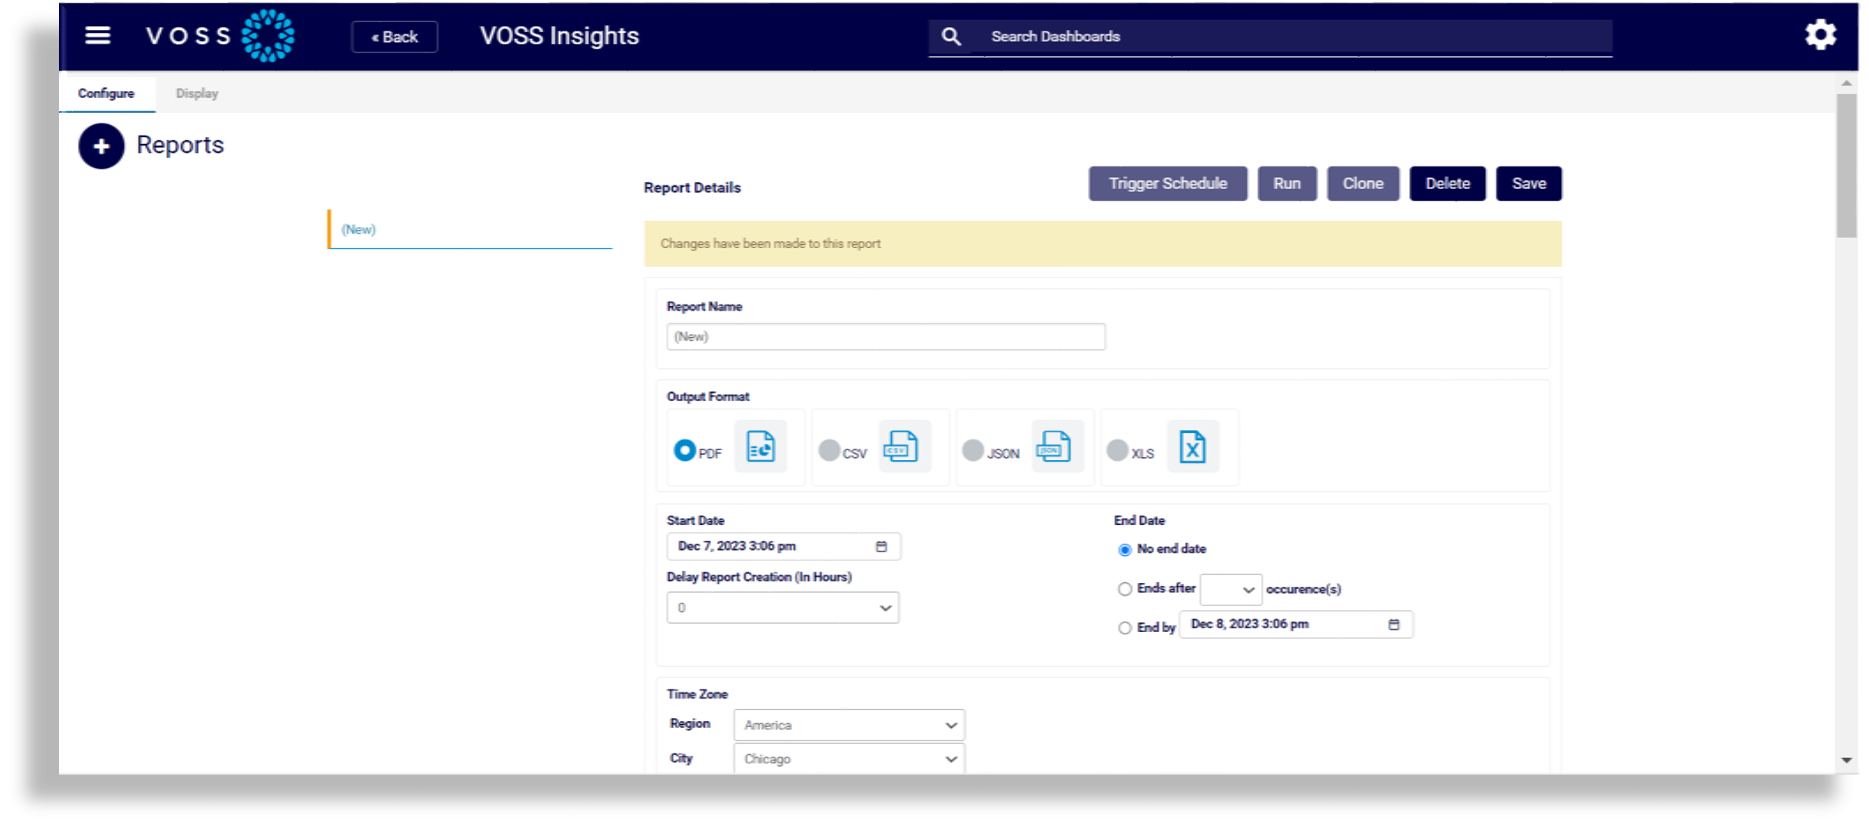
On the Configure tab, click the Plus icon + at Reports to add a new report.
In the Report Name field, give your new report a custom name.
Choose the output format. Options are PDF, CSV, JSON, or XLS.
Note
Outputting to Excel workbooks (
.xls) creates a new tab for each widget inside a single Excel workbook file.Configuration options on the page depend on the output format you choose. For example, only the PDF output format allows you to define widget layout per page.
At Start Date and End Date, select a start date, and report end date options.
At Time Zone, choose a time zone region and city.
Note
The system uses a city library that represents most zone locations. If your city is unavailable, choose an option matching your required time zone.
At Report Interval, choose the period to query data for the report. For example, Last 12 hours.
At Repeats, choose how often you want to repeat the running of this report. Options are: Never, Daily, Weekly, Monthly.
At Descriptions Placement, choose whether to display widget descriptions below the chart(s).
At Widget Layout Per Page, select the number of widgets to print on a page
At Users, click the Plus icon (+) to add recipients (one or more), then select the users who should receive the report.
Note
Non-admin users can also add other users to reports.
At Destination, choose whether to:
only display the report on the GUI: Display only, i.e. no destination
send the report via Email
send the report via SFTP
Note
Reports can be sent via SFTP to a host destination.
Under File name option, if the Override default File name checkbox is selected, report filename options are available to include the username, date and time (
HH_mm_ss) with the name (separated by an underscore_).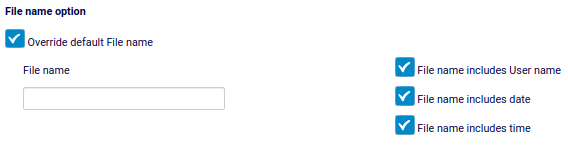
The date format is obtained from the User Settings: (
MMM-D-YYorD-MMM-YY)
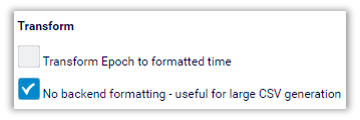
At Transform, choose formatting options.
For the output format you chose (PDF, CSV, JSON, or XLS), define whether to transform epoch to formatted time, and if your selected file output format is CSV, you can also define whether to remove backend formatting in the generated CSV file.
Note
If you’ve chosen the option to remove backend formatting (CSV output only), then all data in the CSV (each cell) will have minimum formatting applied. This speeds up file generation for reports, and when you wish to download a CSV file (via a dashboard widget). This option is thus useful for large files.
At Dashboards, drag the dashboards you want to include in the report, to the Selected Dashboards field.
At Summary Page, use the text editor to design a summary page (including images) that will be placed at the top of the report.
Click Save.
Note
Now you can manually run the report, or you can click Trigger Schedule to generate the report at the predefined schedule value. If you’ve chosen to email the report, the report is emailed to the recipient you specified in Users on the Reports page. Email recipients click the link in the email to open the report in the format you specified, and at the specified IP address - either the default, or a value you provided.