Introduction to Dashboards#
Dashboard Library#
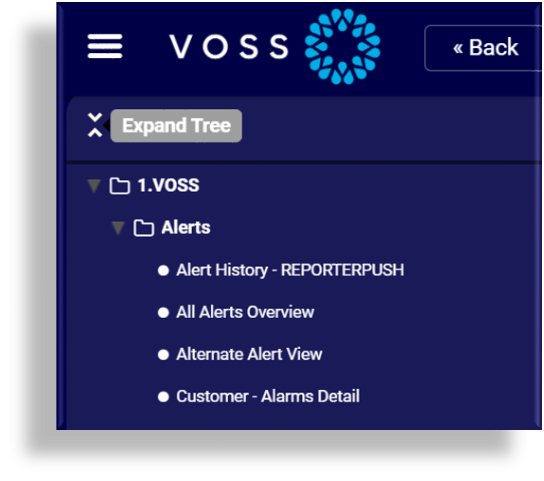
On the Insights Dashboard system user interface, you can access the dashboards library via the Main Menu
![]() (hamburger icon). This panel displays all custom and default (VOSS reference) dashboards,
reports, in folders and sub-folders.
(hamburger icon). This panel displays all custom and default (VOSS reference) dashboards,
reports, in folders and sub-folders.
To expand or collapse the entire tree in the panel, click the Expand Tree icon at the top of the panel.
Related Topics
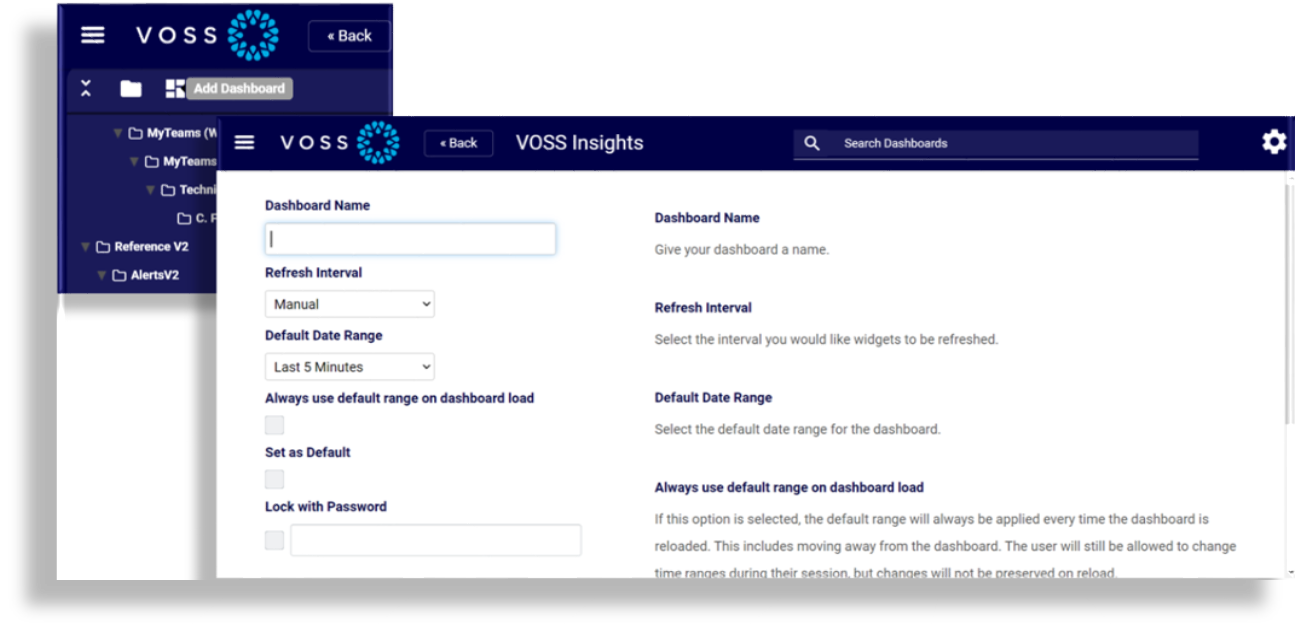
Add a New Custom Dashboard#
To add a new, custom dashboard from the dashboard library panel, click the Add Dashboard icon at the top of the panel. This opens a new page where you can add details for your new, custom dashboard.
Now you will need to create resource definitions and widgets to use in your dashboard.
Note
To make a custom dashboard based on a default dashboard, you can make a copy (clone) of one of the default dashboards, then modify the clone and save it as a new, custom dashboard.
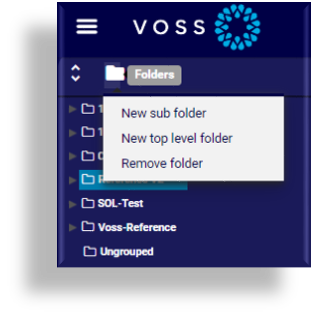
Add or Remove Dashboard Folders#
Dashboards are organized initially in alphabetical order. When creating dashboards, you can organize these into folders that expand out into trees based on the order you define.
To add or remove folders in the tree, click the Folders icon at the top of the dashboard library panel. When removing a folder, first select the folder in the tree.
You can drag and drop a sub-folder into the relevant top-level folder, or drag the relevant dashboard into a folder.
Note
Dashboards with the same name can exist in different folders. The names of dashboards in the same folder must be unique.