
Insights Reference Dashboards#
Overview#
Insights Dashboard ships with a collection of deployment-ready, read-only, standard reference dashboards that are configured with predefined policies (alerting dashboards only), probes, and probe groups. This means you’ll be able to deploy Insights without having to manually add and assign probes to retrieve and display reporting data on these dashboards.
Important
The Insights reference dashboards described in this topic is the standard set shipped with the latest Insights release. This collection may be updated at each software release.
The Insights reference dashboards are read-only, they can’t be edited, deleted, or moved. If you wish to use one of the Insights reference dashboards, you’ll need to create a copy (clone), then modify the clone to create a new, custom dashboard that meets your requirements.
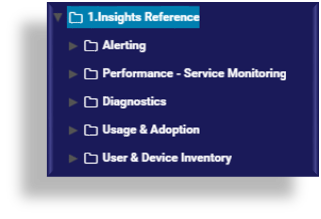
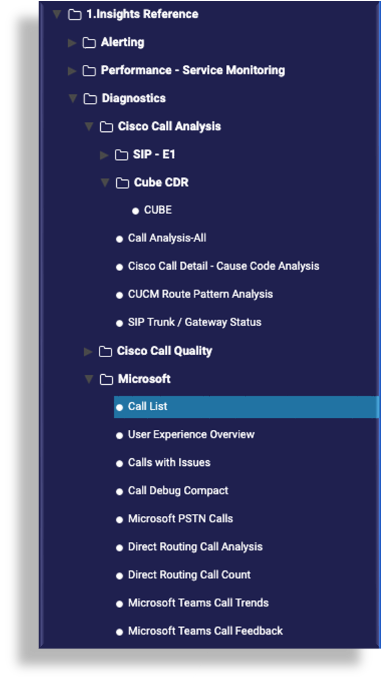
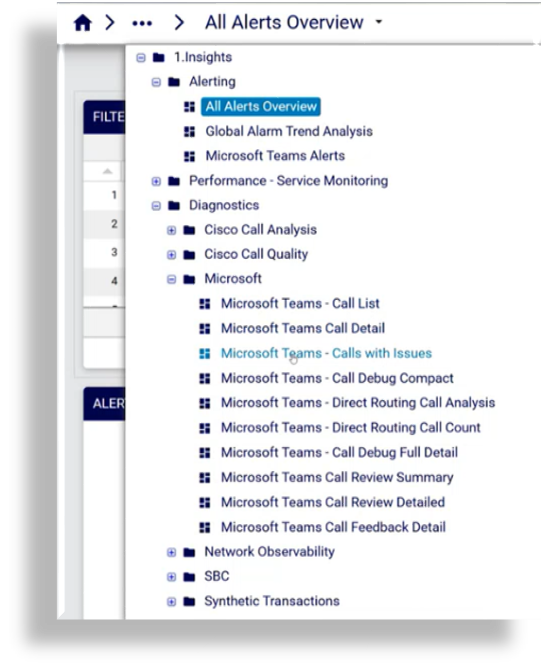
To access the reference dashboards, click the Menu icon (hamburger) ![]() to
display the dashboards library pane on the left of the GUI. Expand the tree to locate
the Insights Reference dashboards folder. The dashboards are grouped in category sub-folders -
at the time of writing, these are:
to
display the dashboards library pane on the left of the GUI. Expand the tree to locate
the Insights Reference dashboards folder. The dashboards are grouped in category sub-folders -
at the time of writing, these are:
Tip
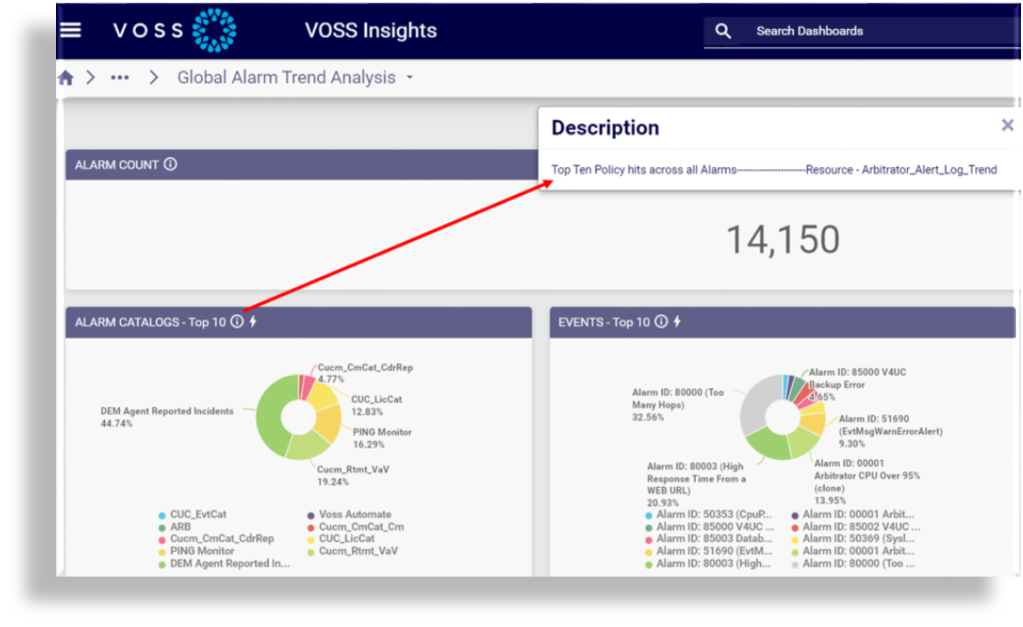
To view a description of the data displayed in any of the widgets added to the dashboards, click the information icon in the widget header.
Microsoft Teams Dashboards#
Dashboards displaying Microsoft Teams data obtain data from Microsoft Teams to report on user activity and resource usage in your system - for example, data relating to devices, chat, meetings, and calls. Data can also be obtained for user licenses and subscribed SKUs, which allows you to determine how licenses are being used in your organization so that you can manage license costs.
Call records from Microsoft Teams are pulled into the Arbitrator using Microsoft Graph API, and are used for alarms and reporting.
Related topics
Alerting#
The Alerting reference dashboards are based on pre-defined policies that ship with the system define when an event coming in to the system will trigger an alert. When there’s a match for the condition specified in the policy, an alert is raised and forwarded to the Dashboard system.
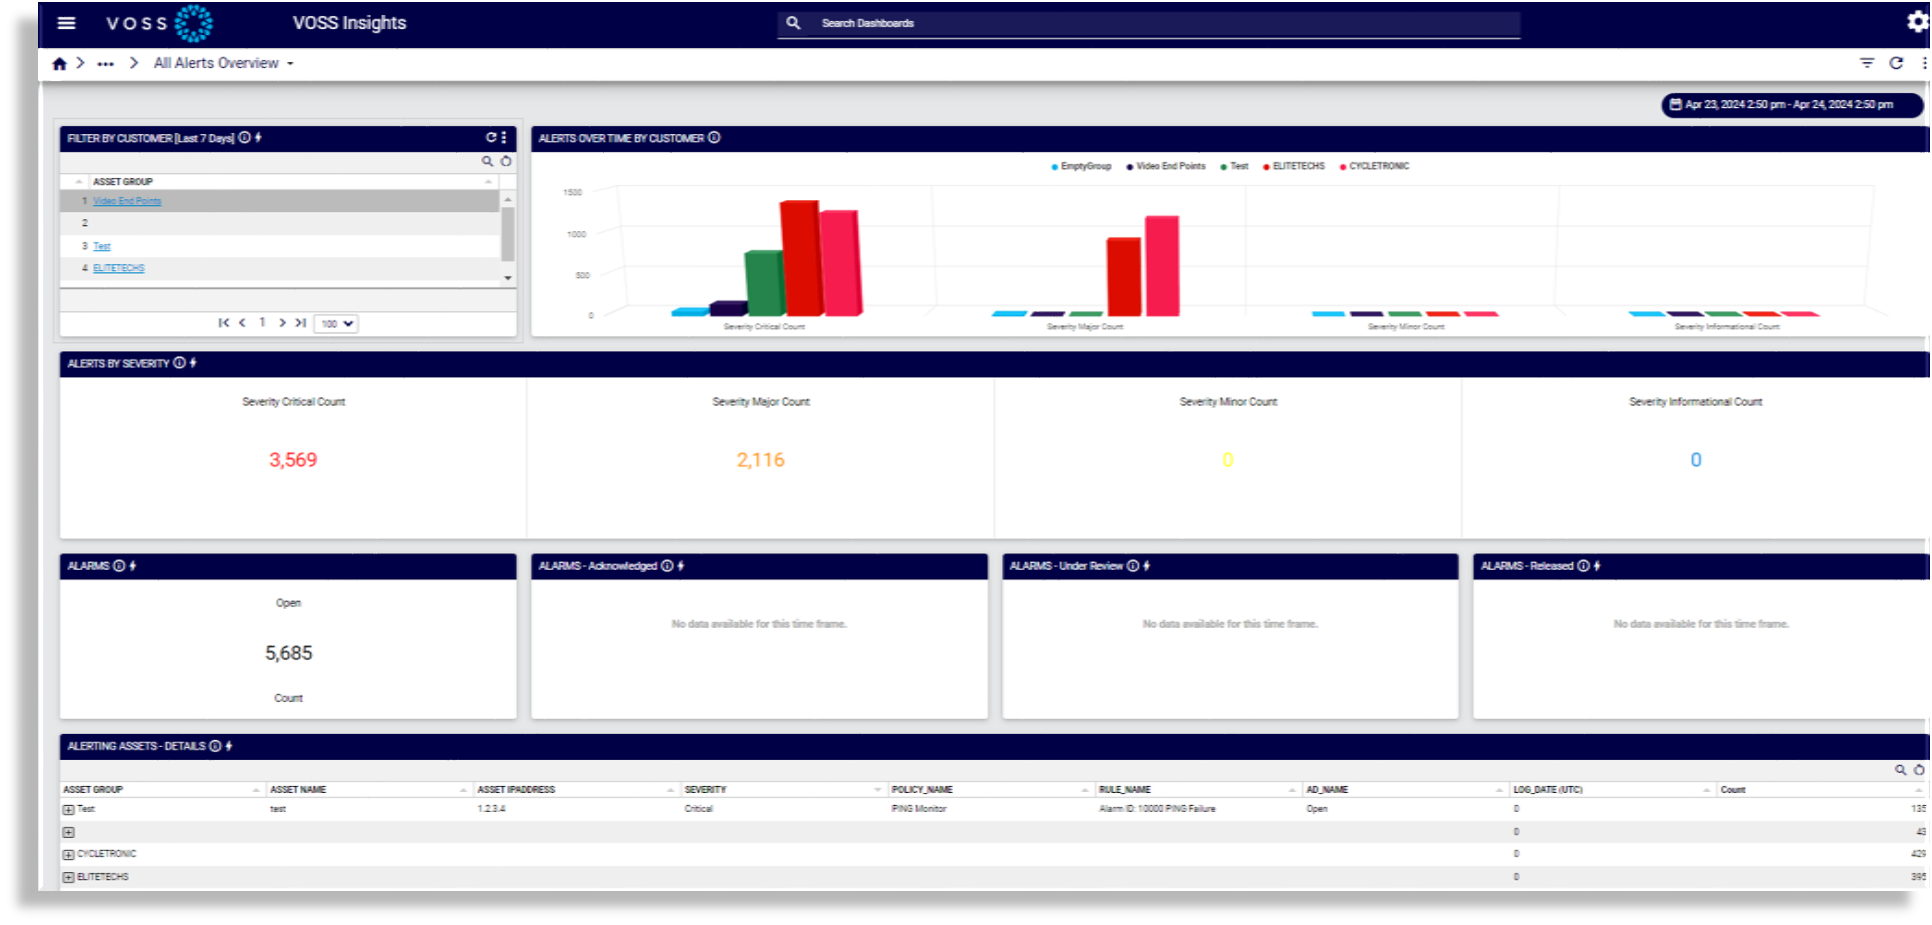
All Alerts Overview#
The All Alerts Overview dashboard provides an overview of all alerts and alarms, such as alerts by severity and alerts over time by customer.
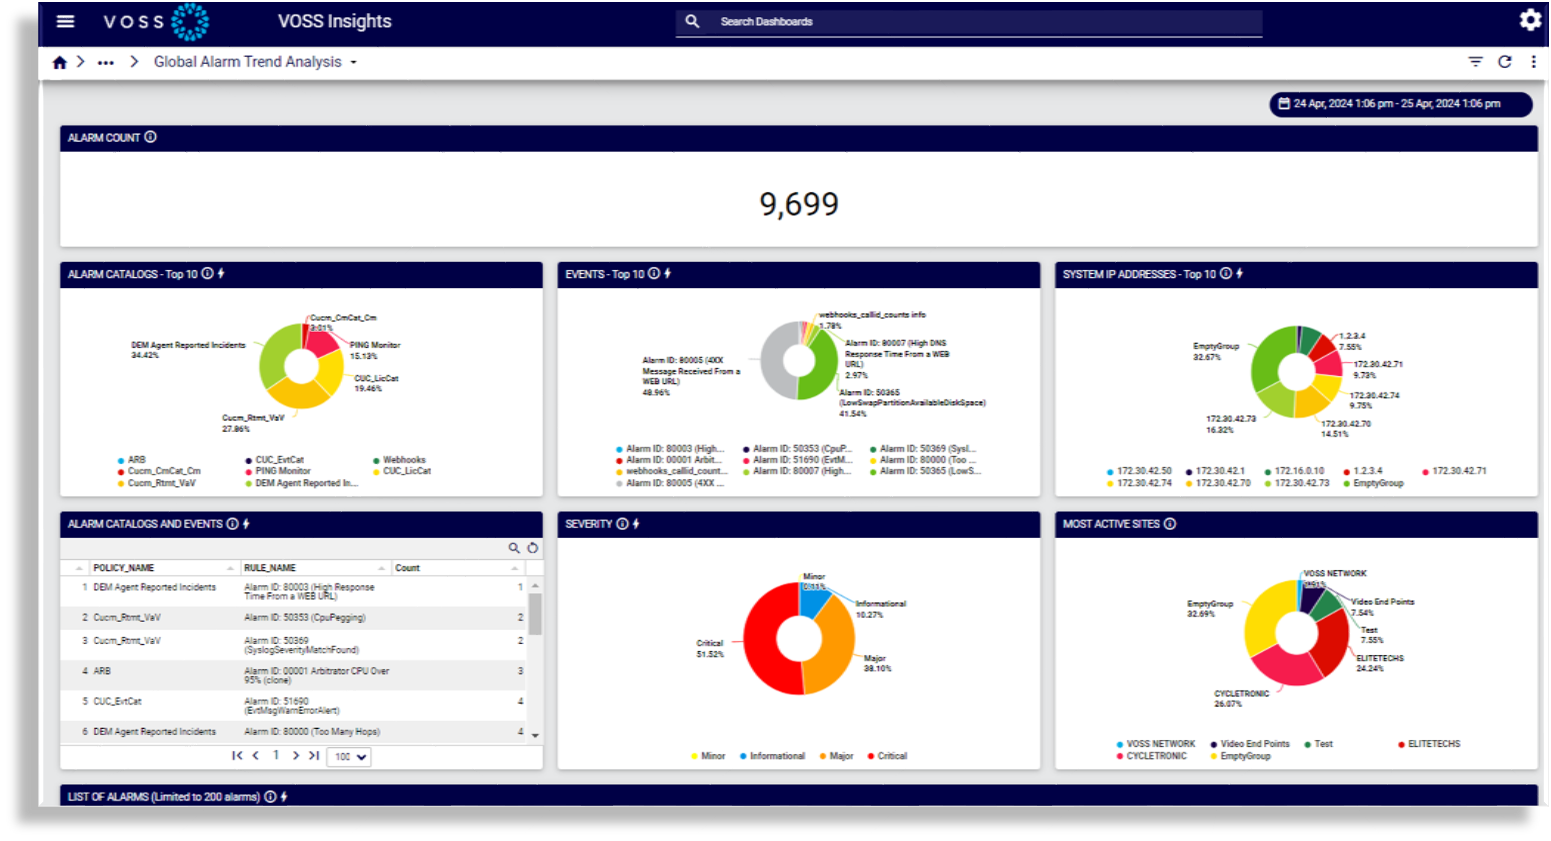
Global Alarm Trend Analysis#
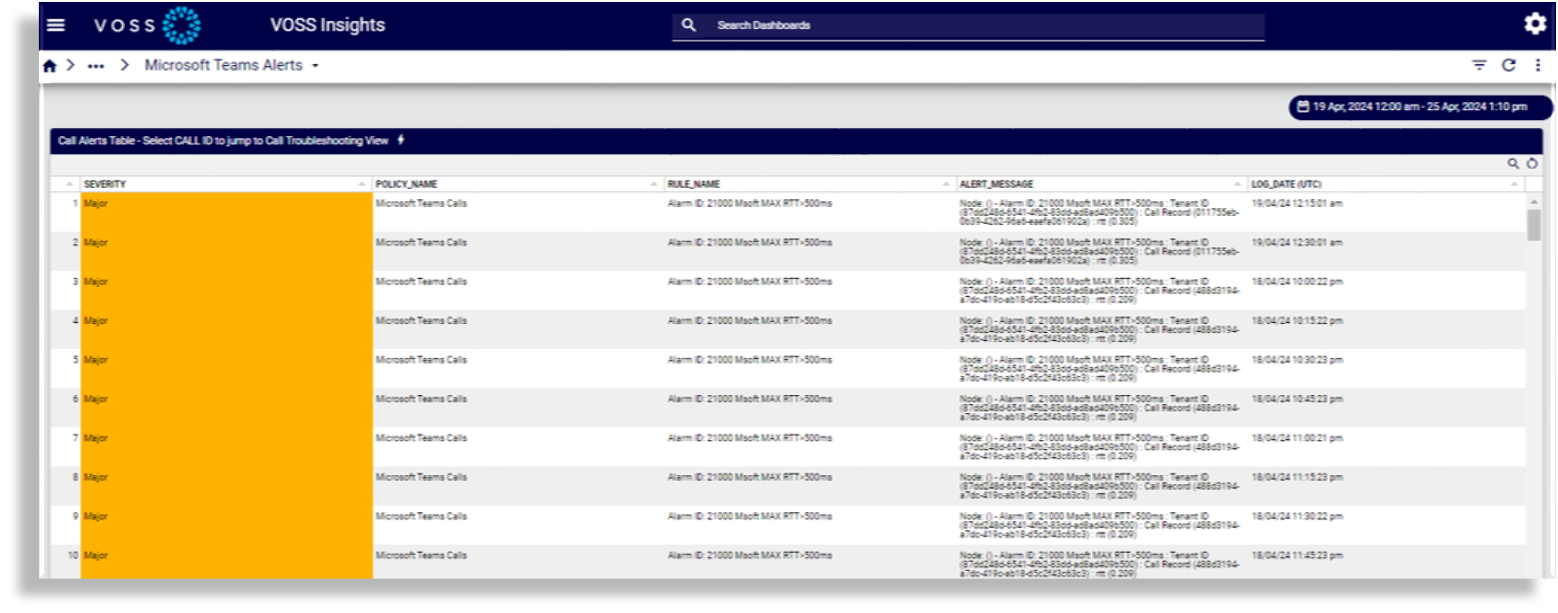
Microsoft Teams Alerts#
Performance - Service Monitoring#
Reference dashboards in the Performance - Service Monitoring category display performance and service statistics for Cisco devices, Microsoft devices, and Insights components (DS9, Dashboard, and Arbitrator).
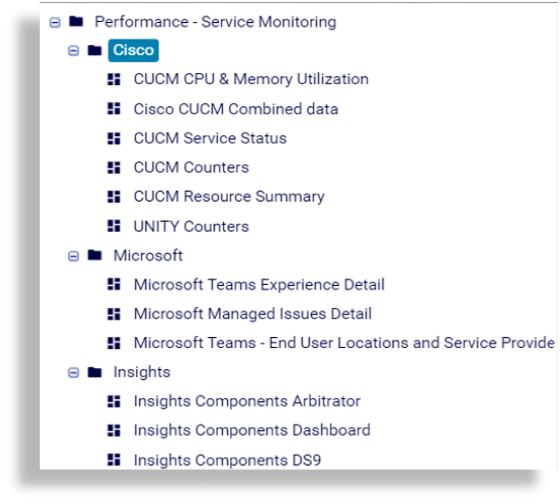
Cisco#
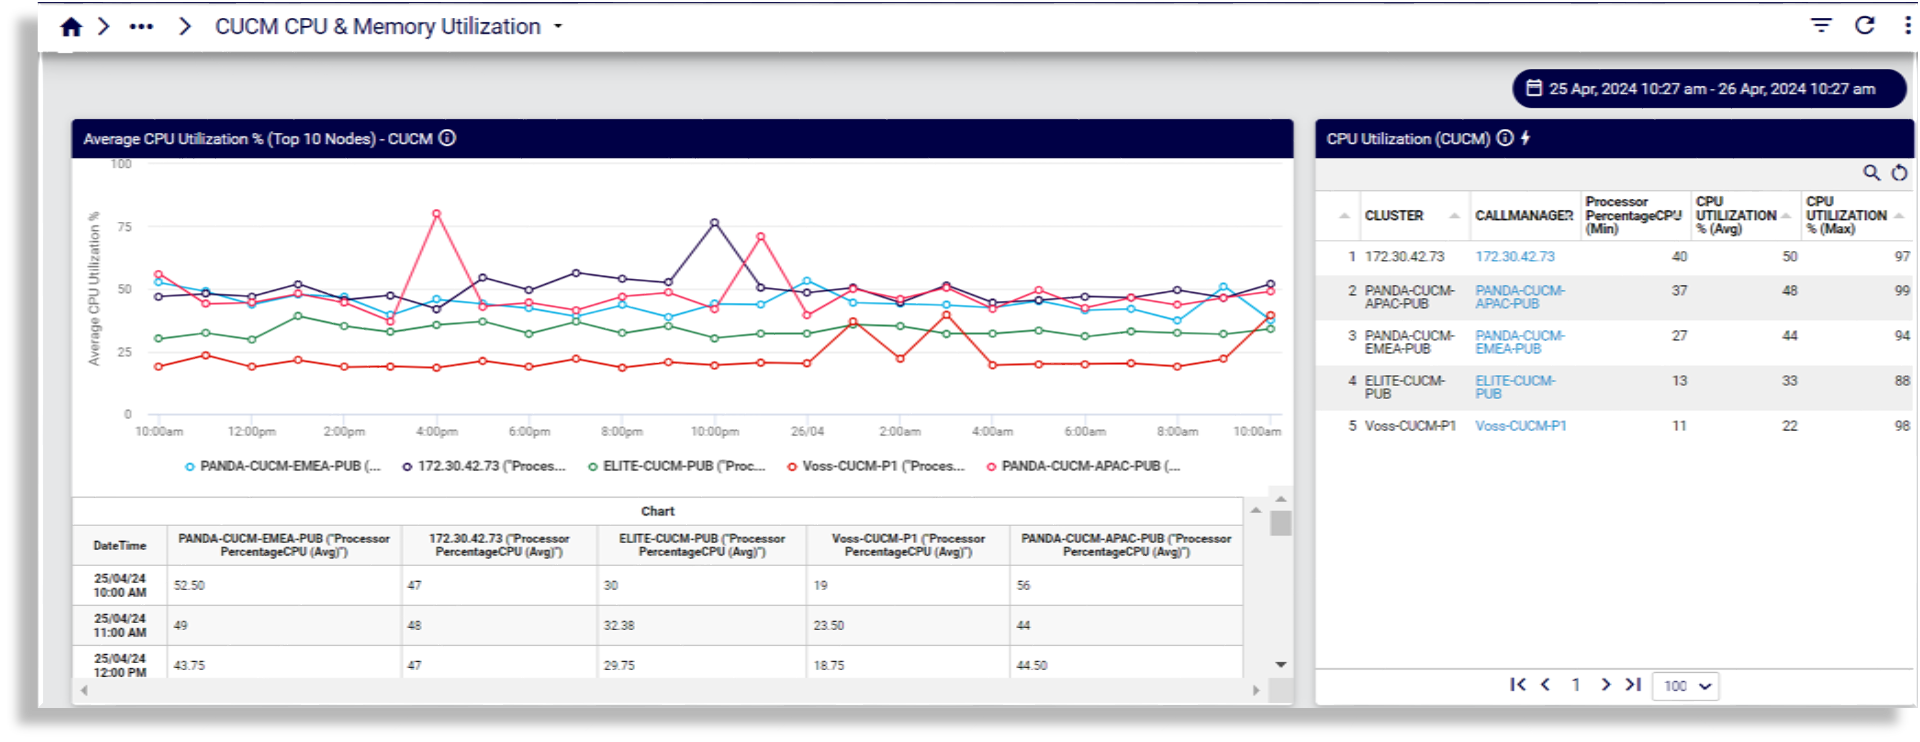
CUCM CPU & Memory Utilization
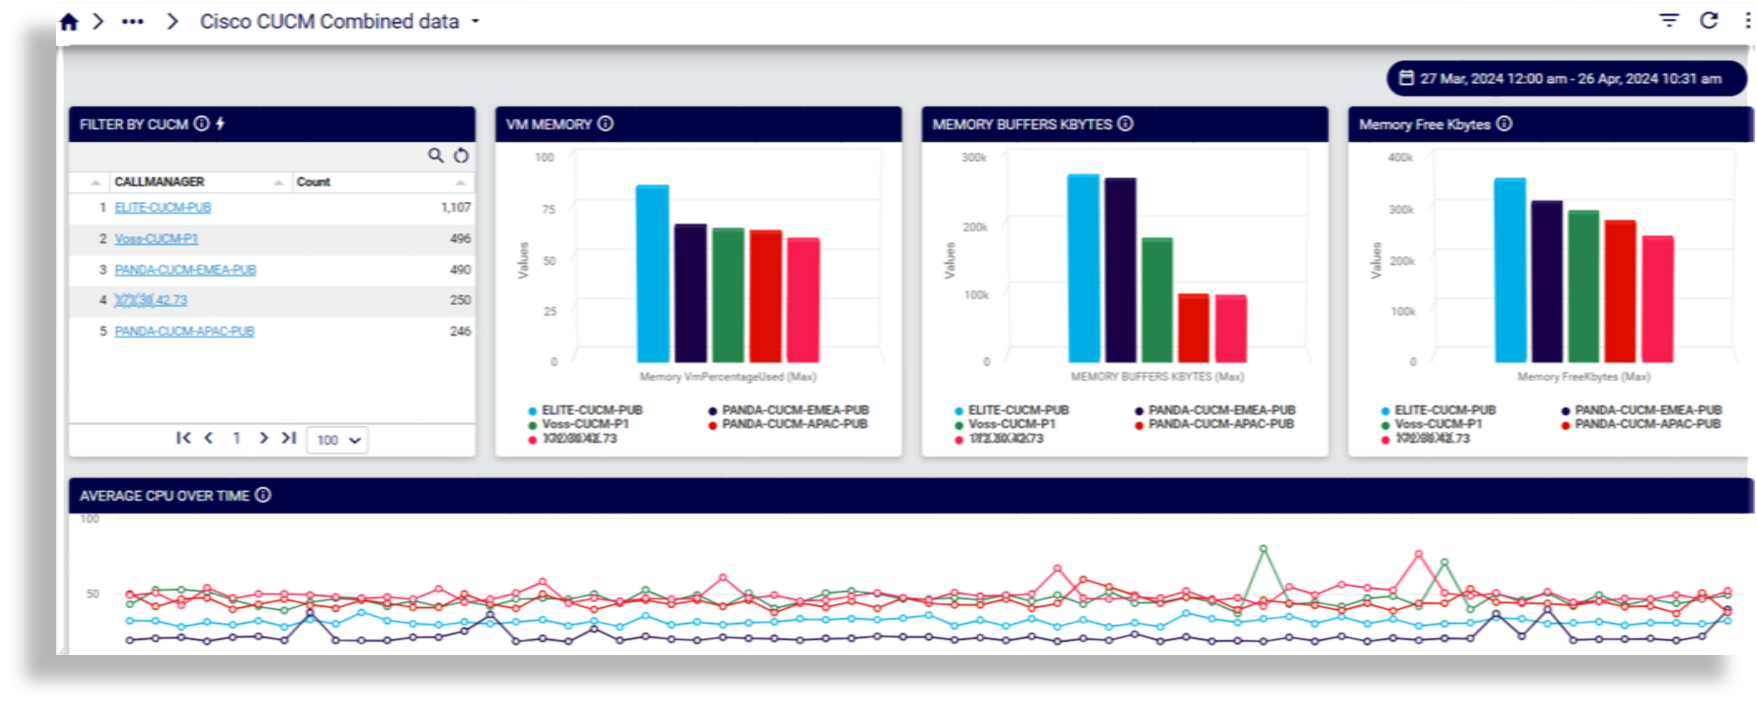
Cisco CUCM Combined data
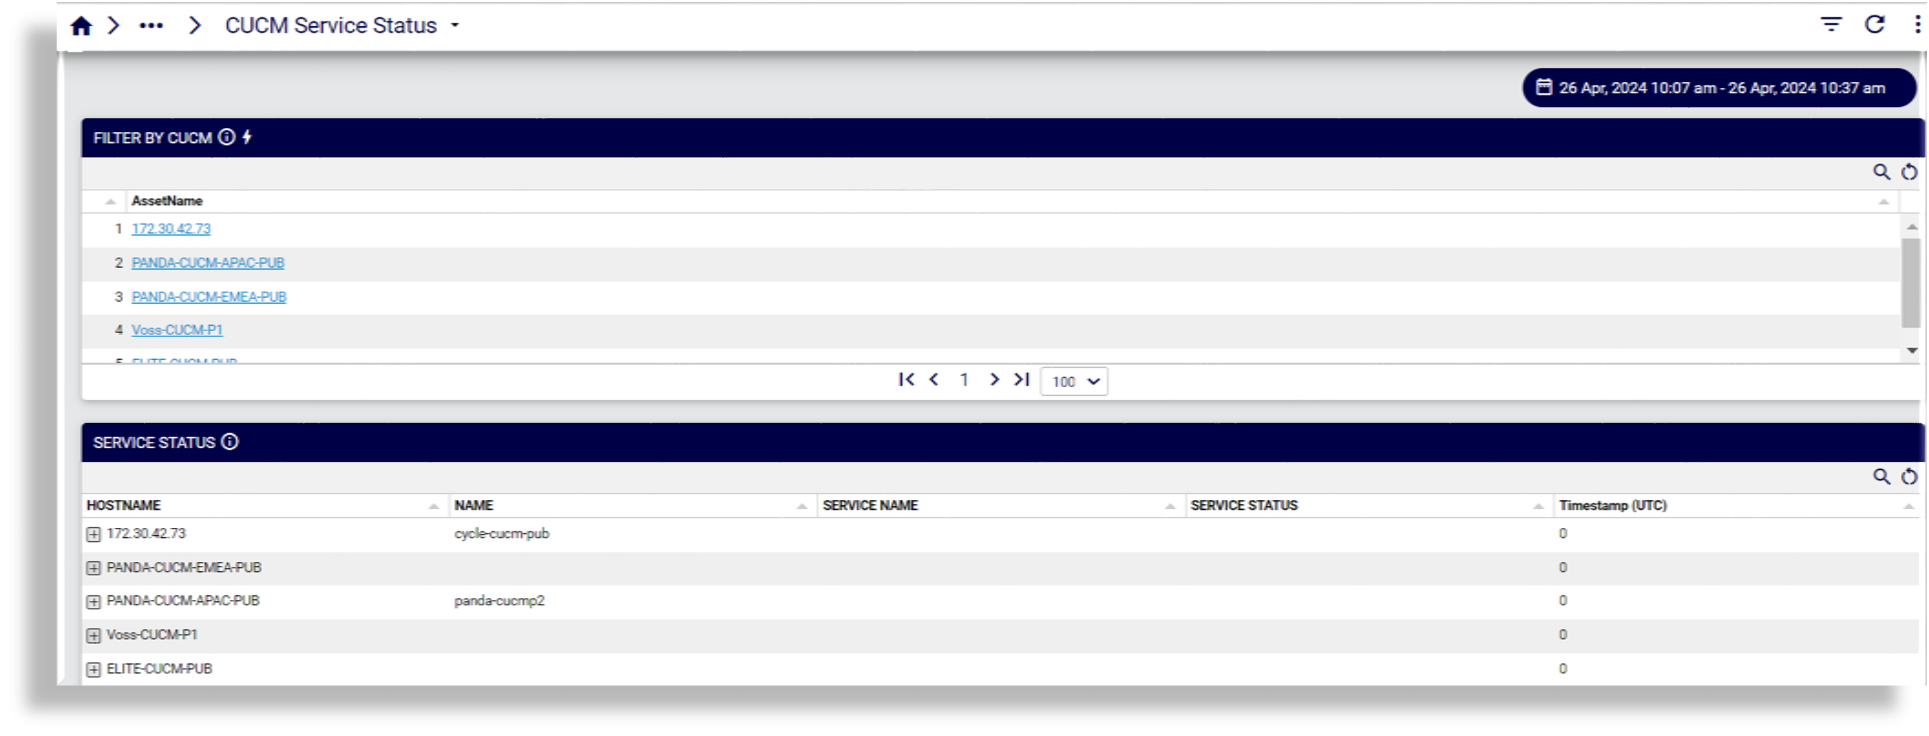
CUCM Service Status
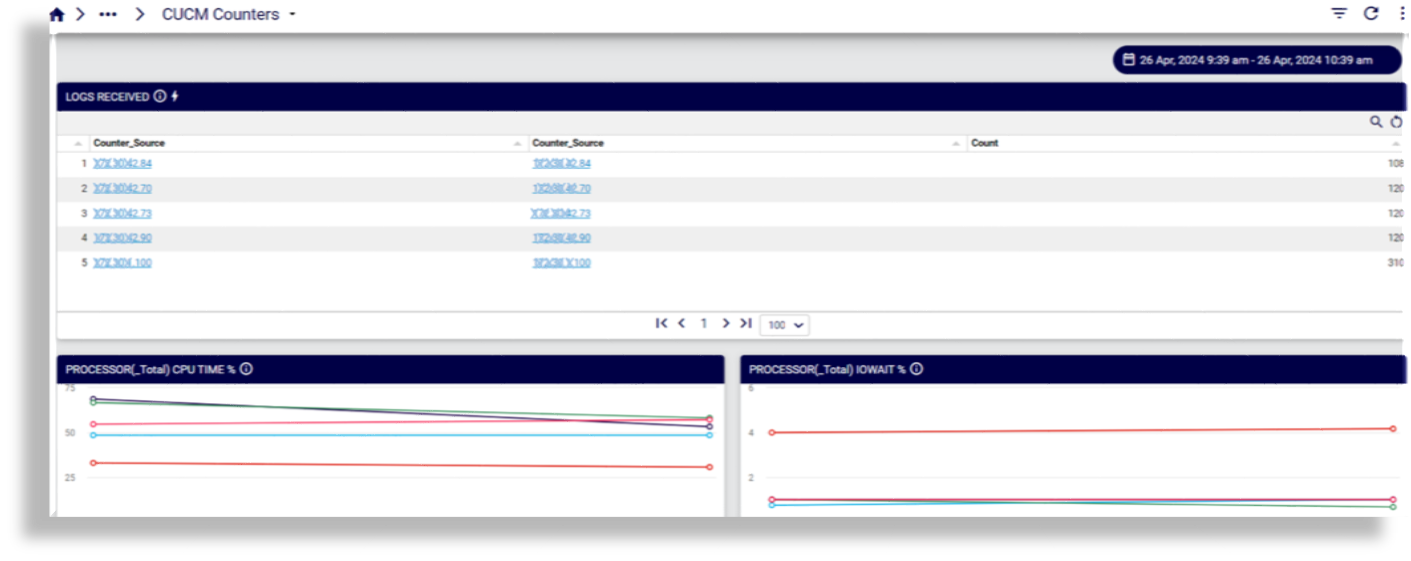
CUCM Counters
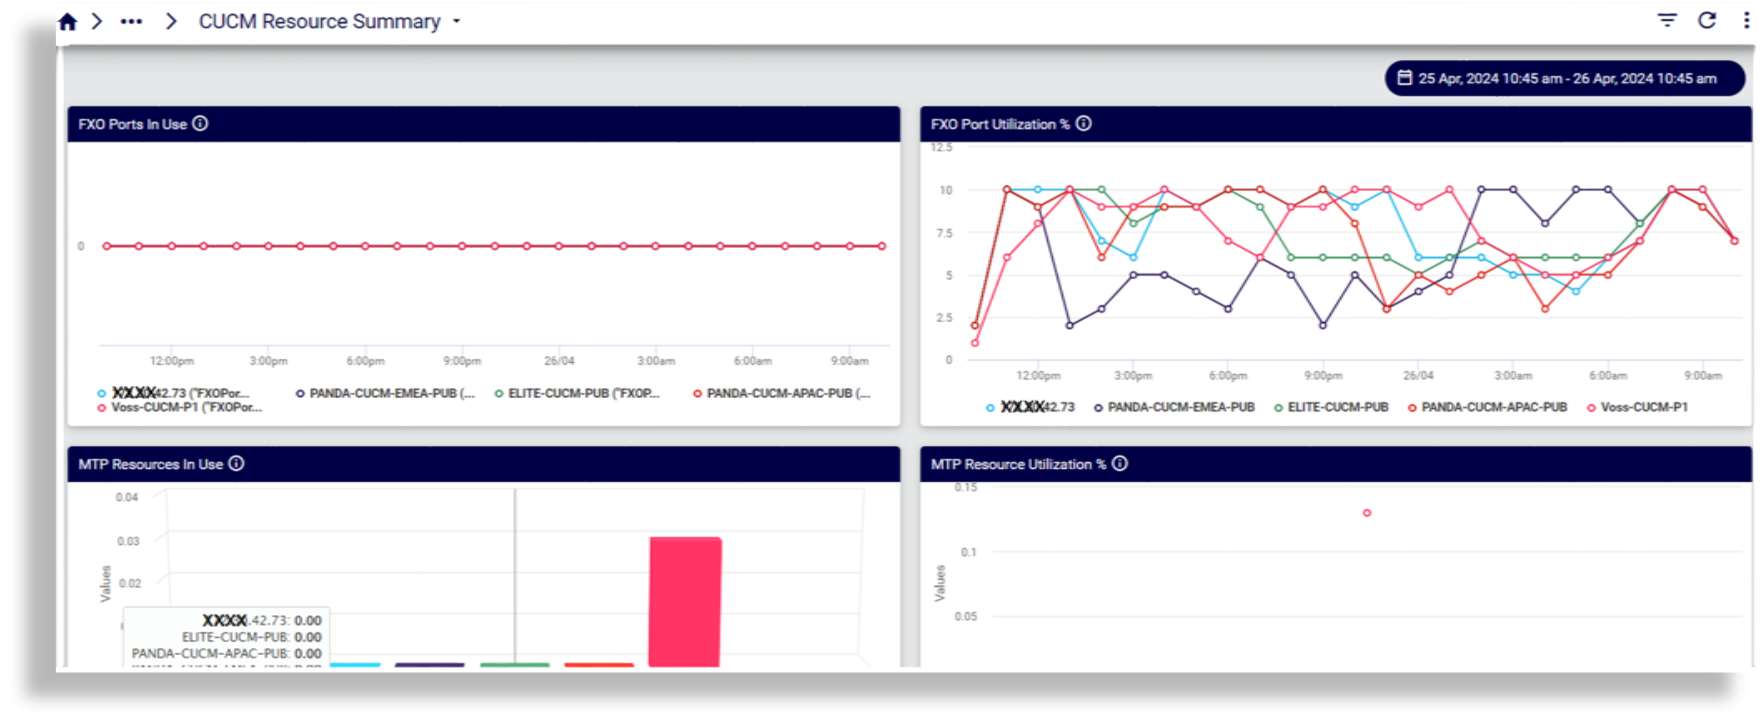
CUCM Resource Summary
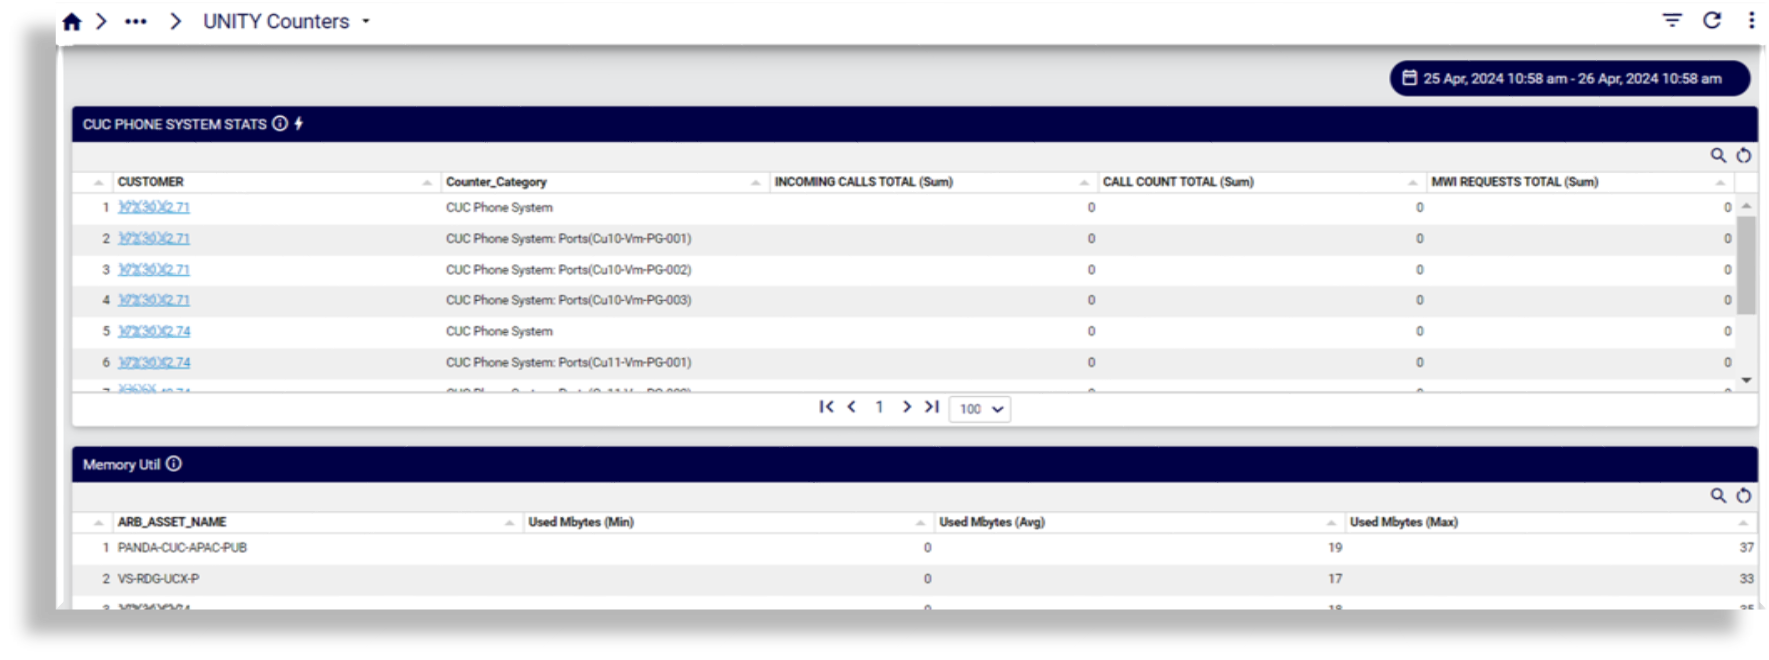
UNITY Counters
Microsoft#
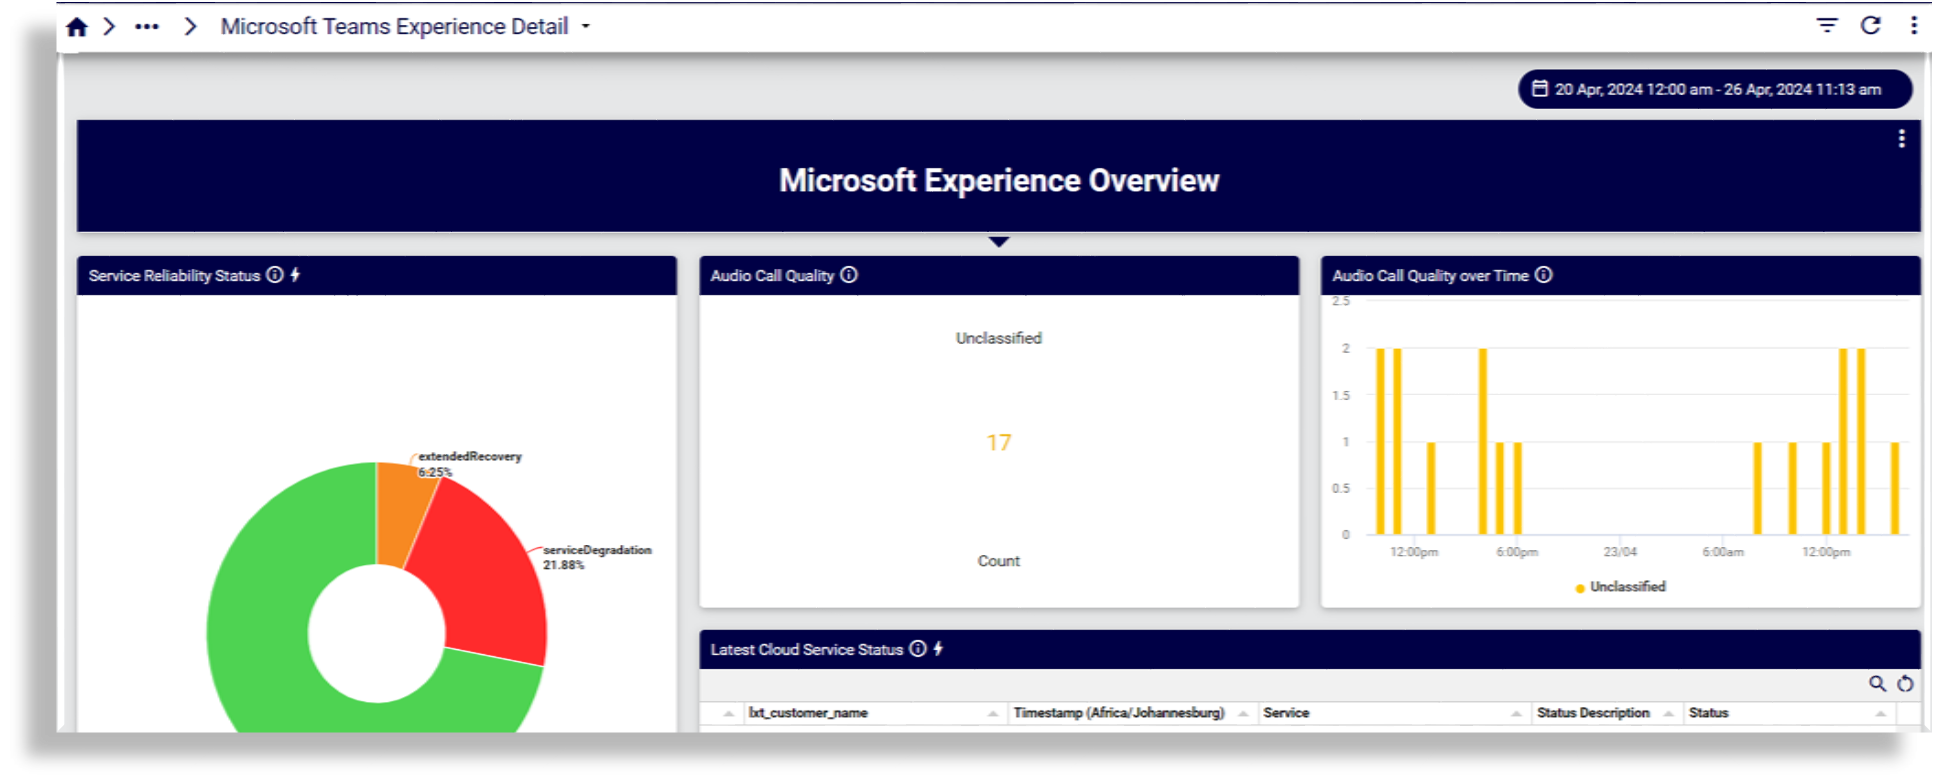
Microsoft Teams Experience Detail
Reports on service reliability status, call quality, over time, cloud service status, jitter, including audio; packet loss; round trip time
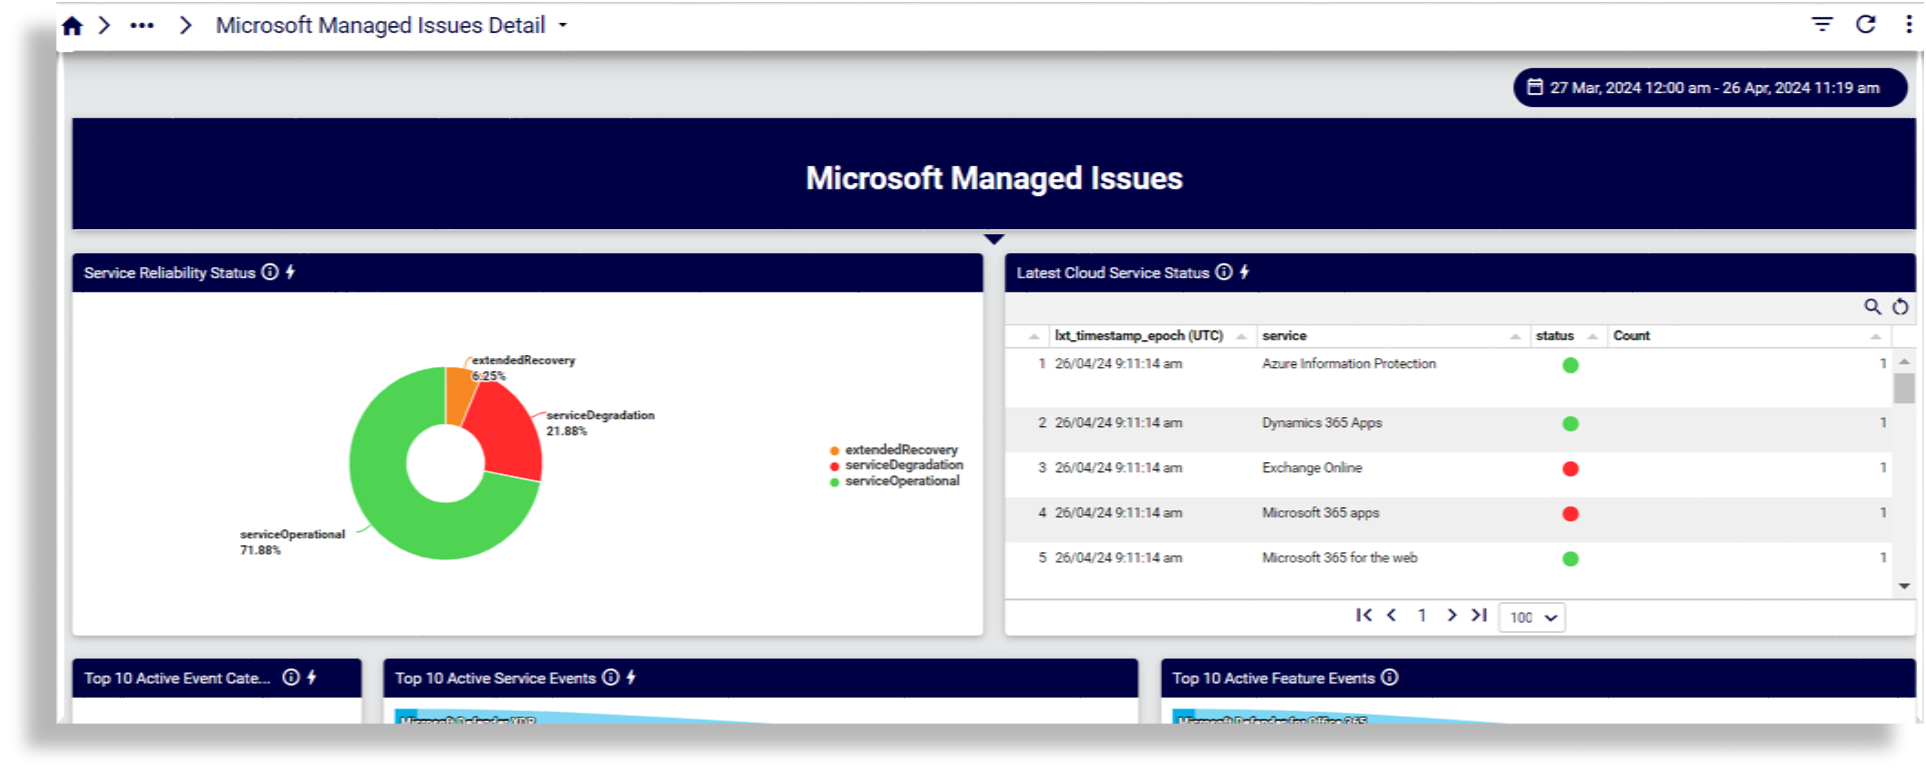
Microsoft Managed Issues Detail
Reports on service reliability; cloud service status; top active event categories, service events, feature events; incident resolved indicator; Microsoft event list and journal
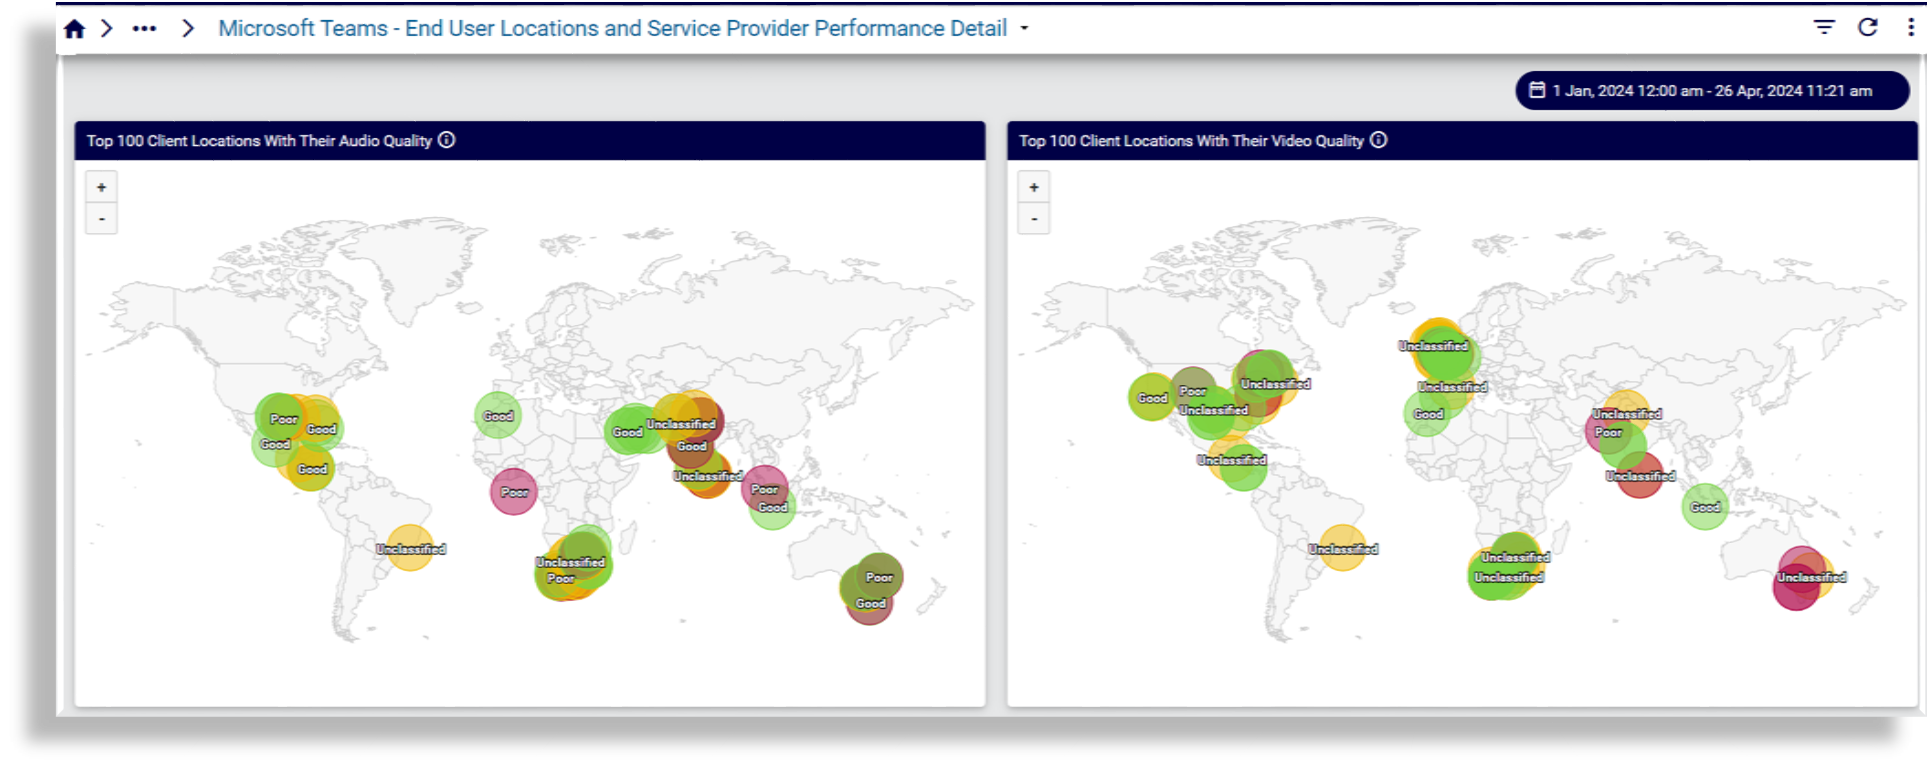
Microsoft Teams - End User Locations and Service Provider Performance Detail
Reports on top locations and service providers by poor audio density and quality, video density and quality; call types; connection types
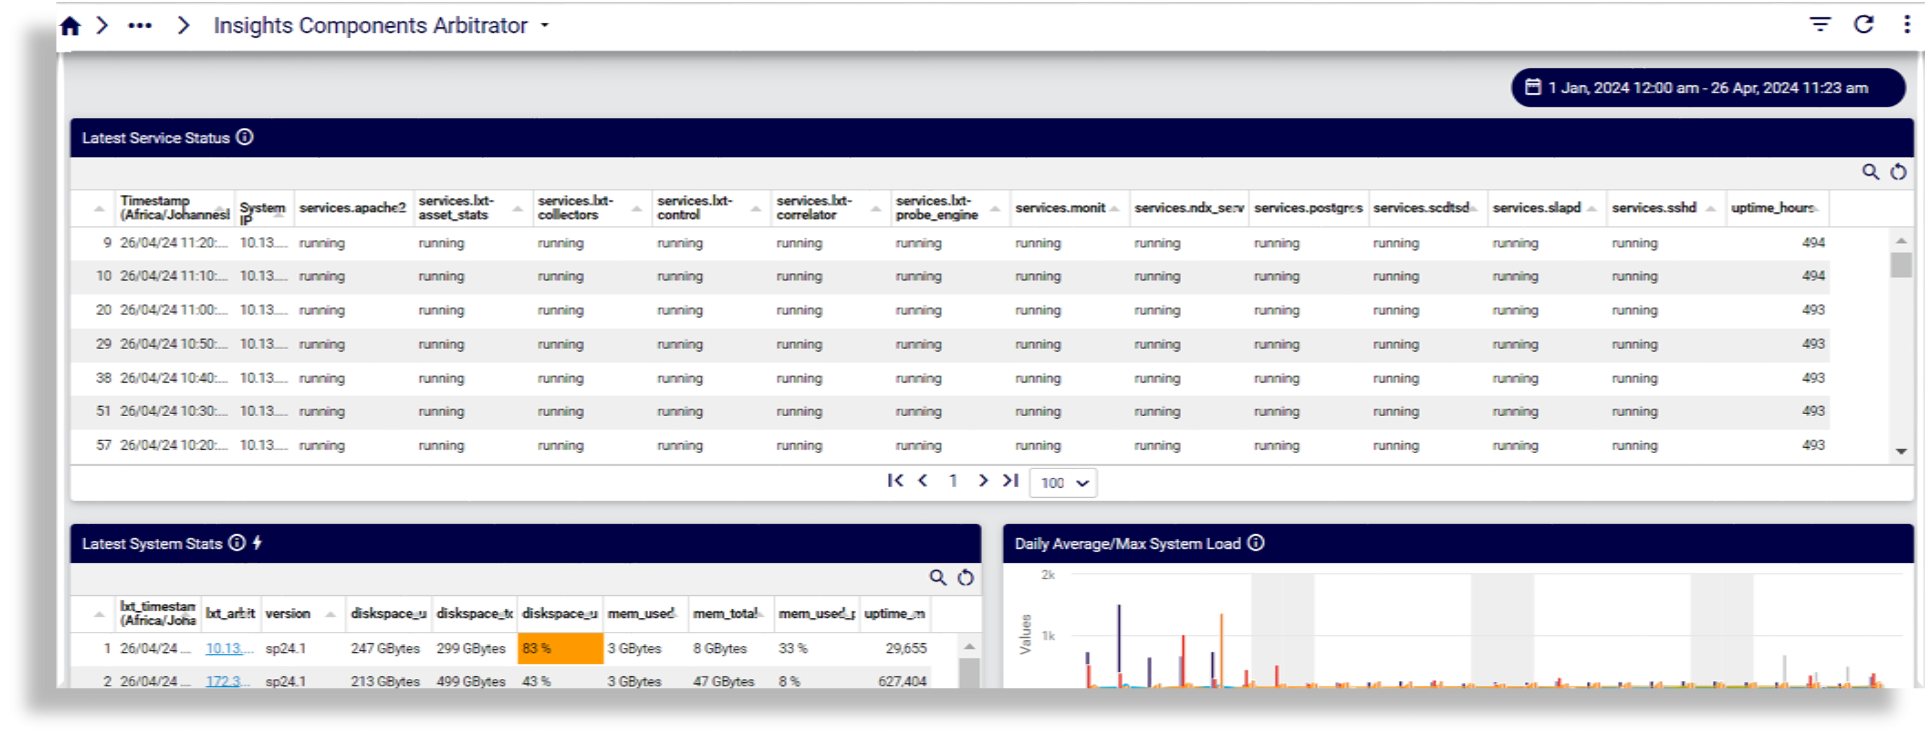
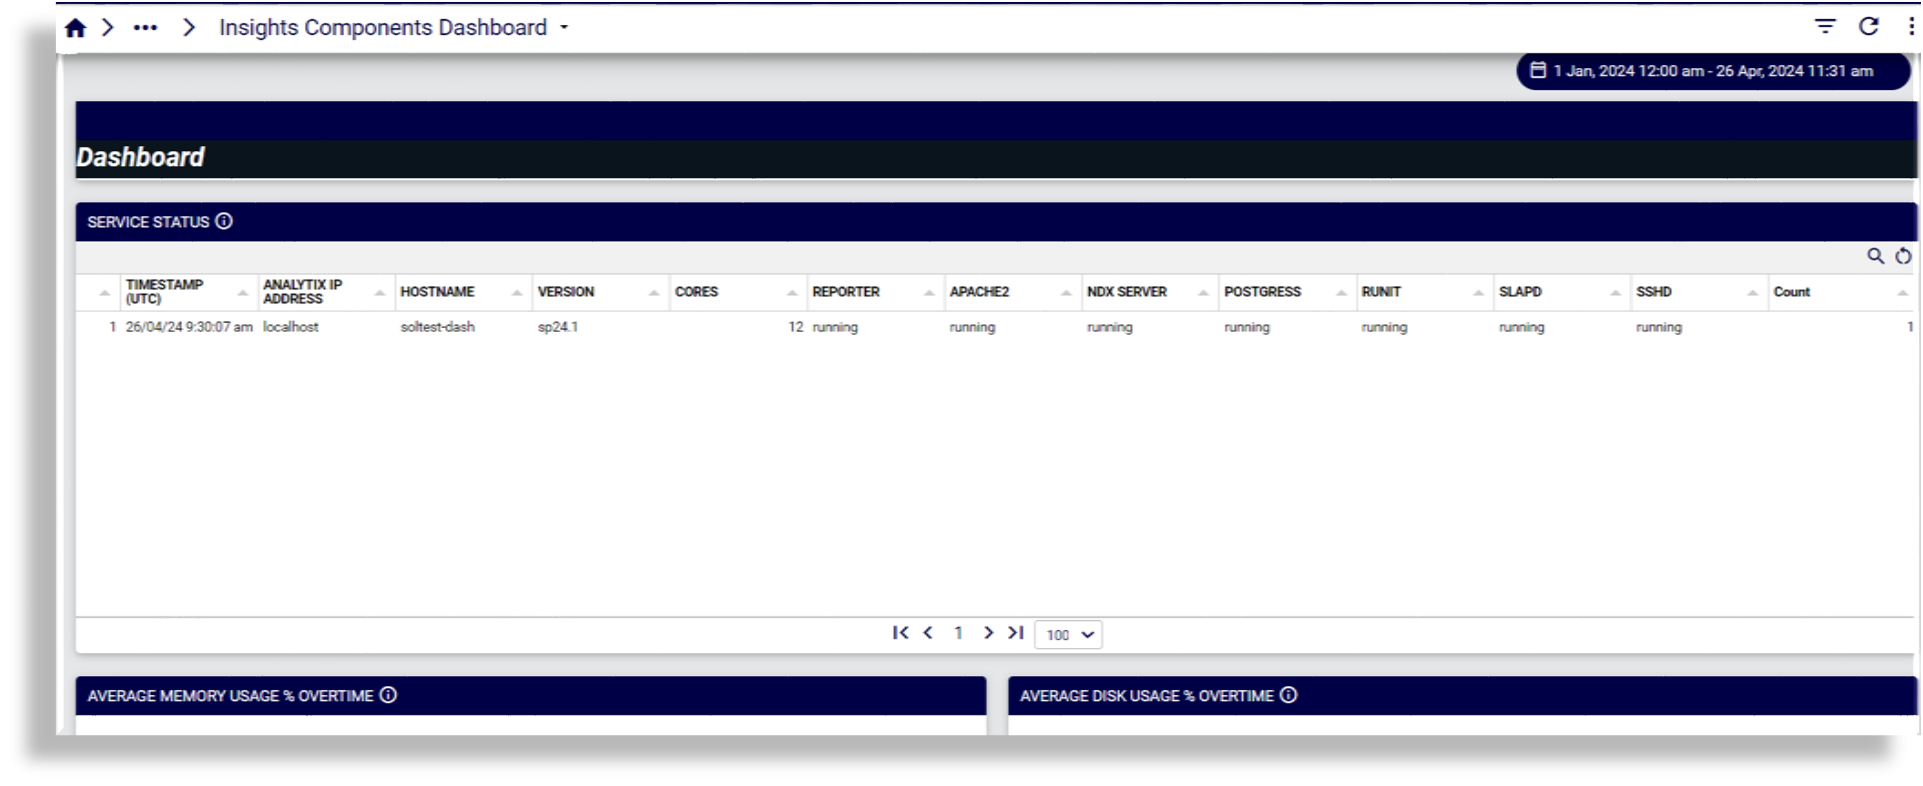
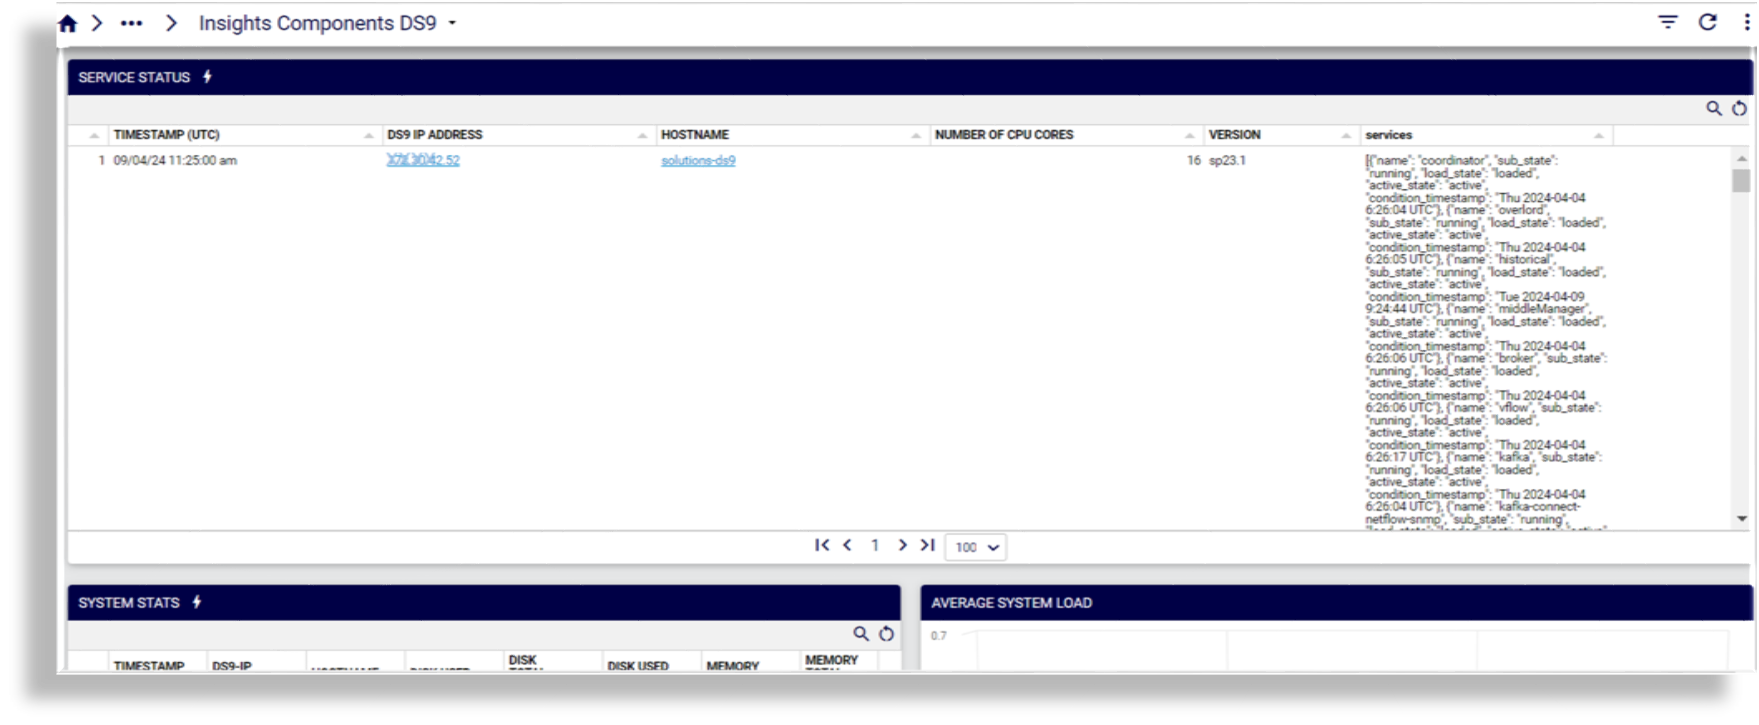
Insights#
Insights Components Arbitrator
Insights Components Dashboard
Insights Components DS9
Diagnostics#
Reference dashboards in the Diagnostics category display diagnostics for SIP - E1, Cisco call quality, Microsoft call statistics, and synthetic transactions.
Cisco Call Analysis > SIP - E1#
Cisco UCM SIP Trunk Reports
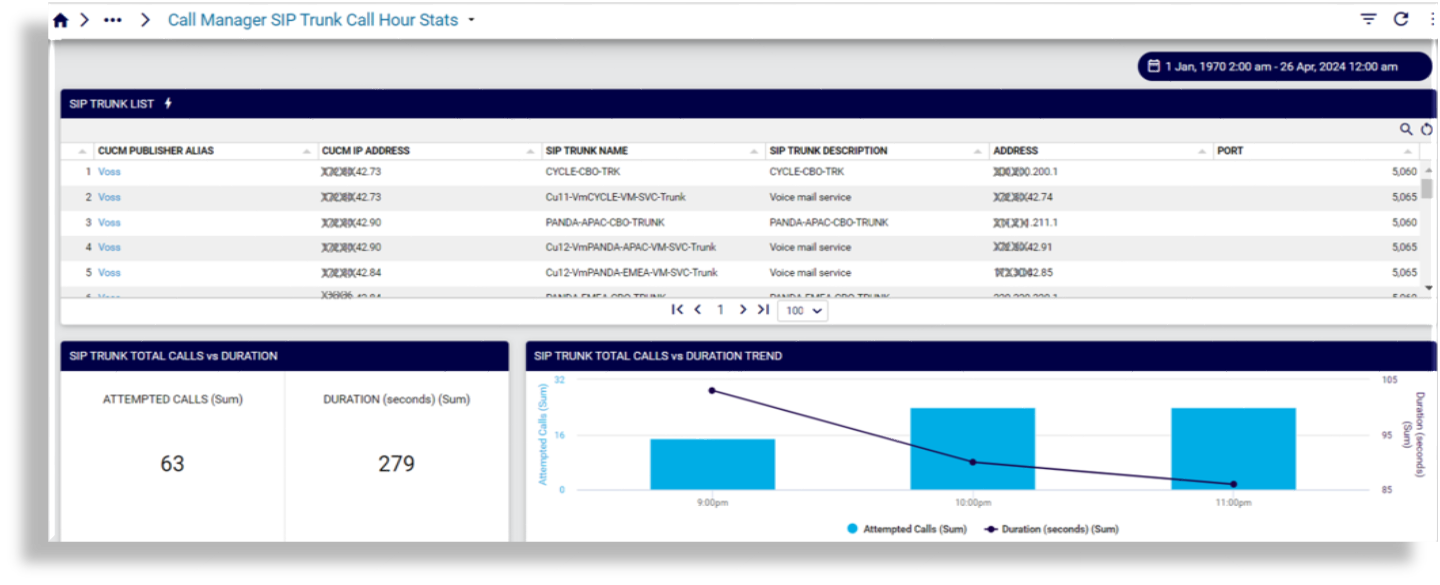
Call Manager SIP Trunk Call Hour Stats
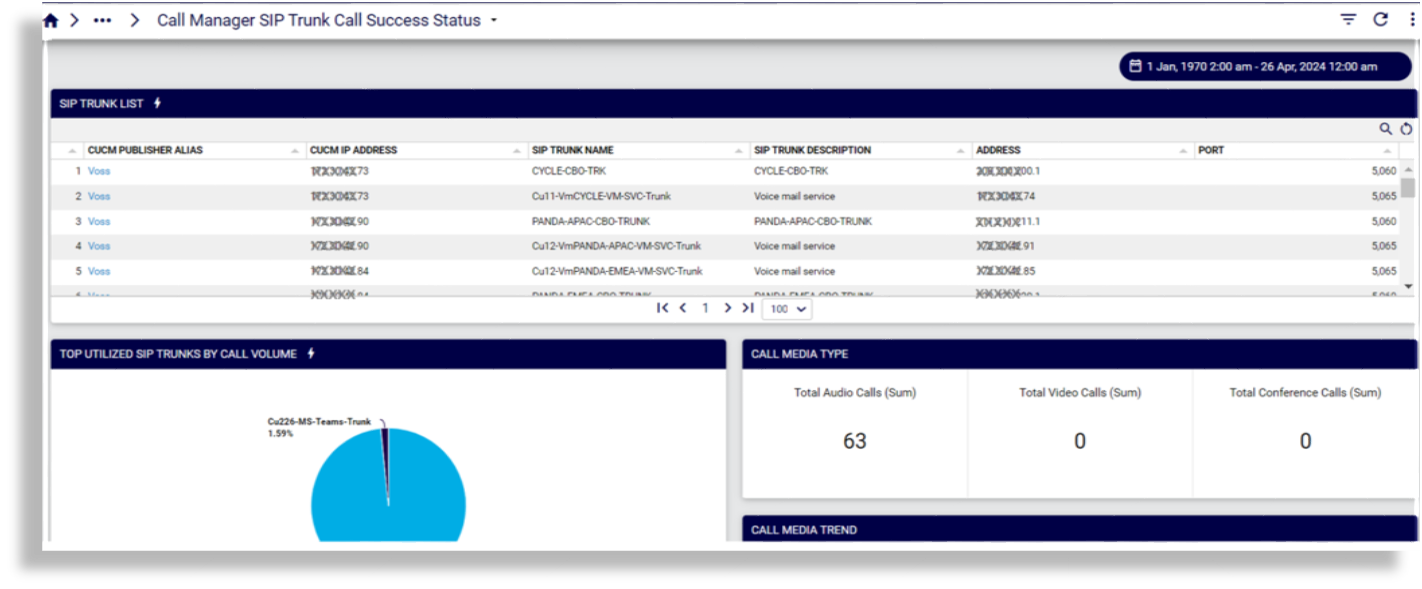
Call Manager SIP Trunk Call Success Status
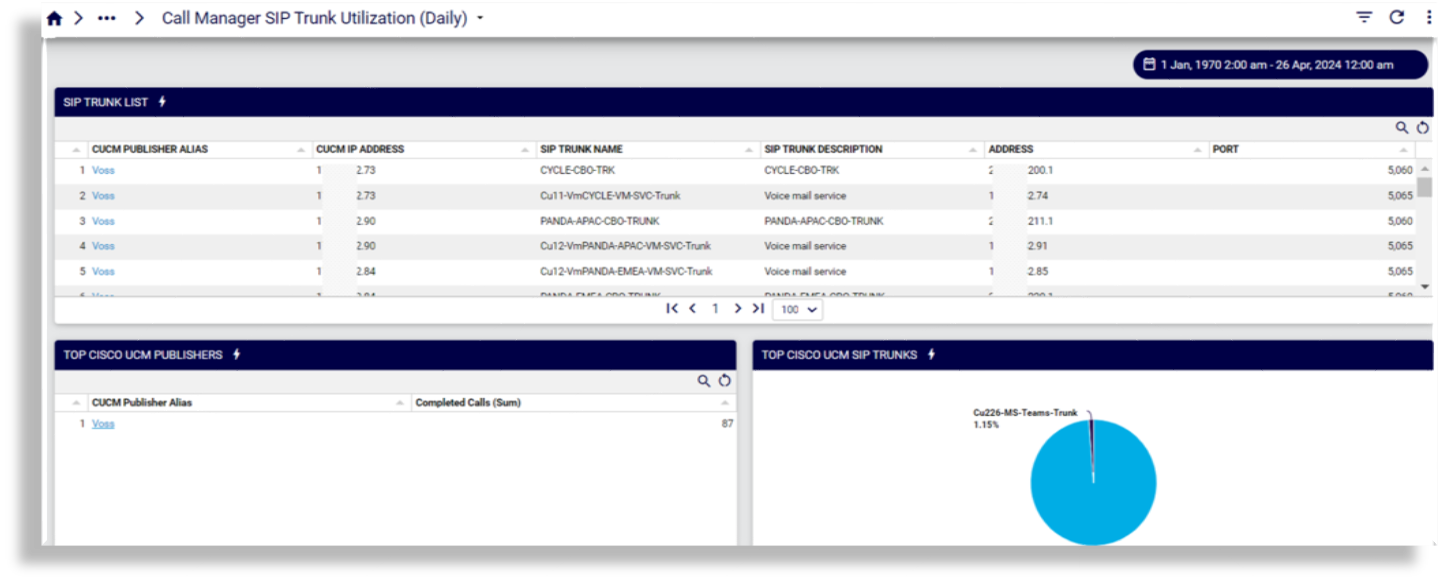
Call Manager SIP Trunk Utilization (Daily)
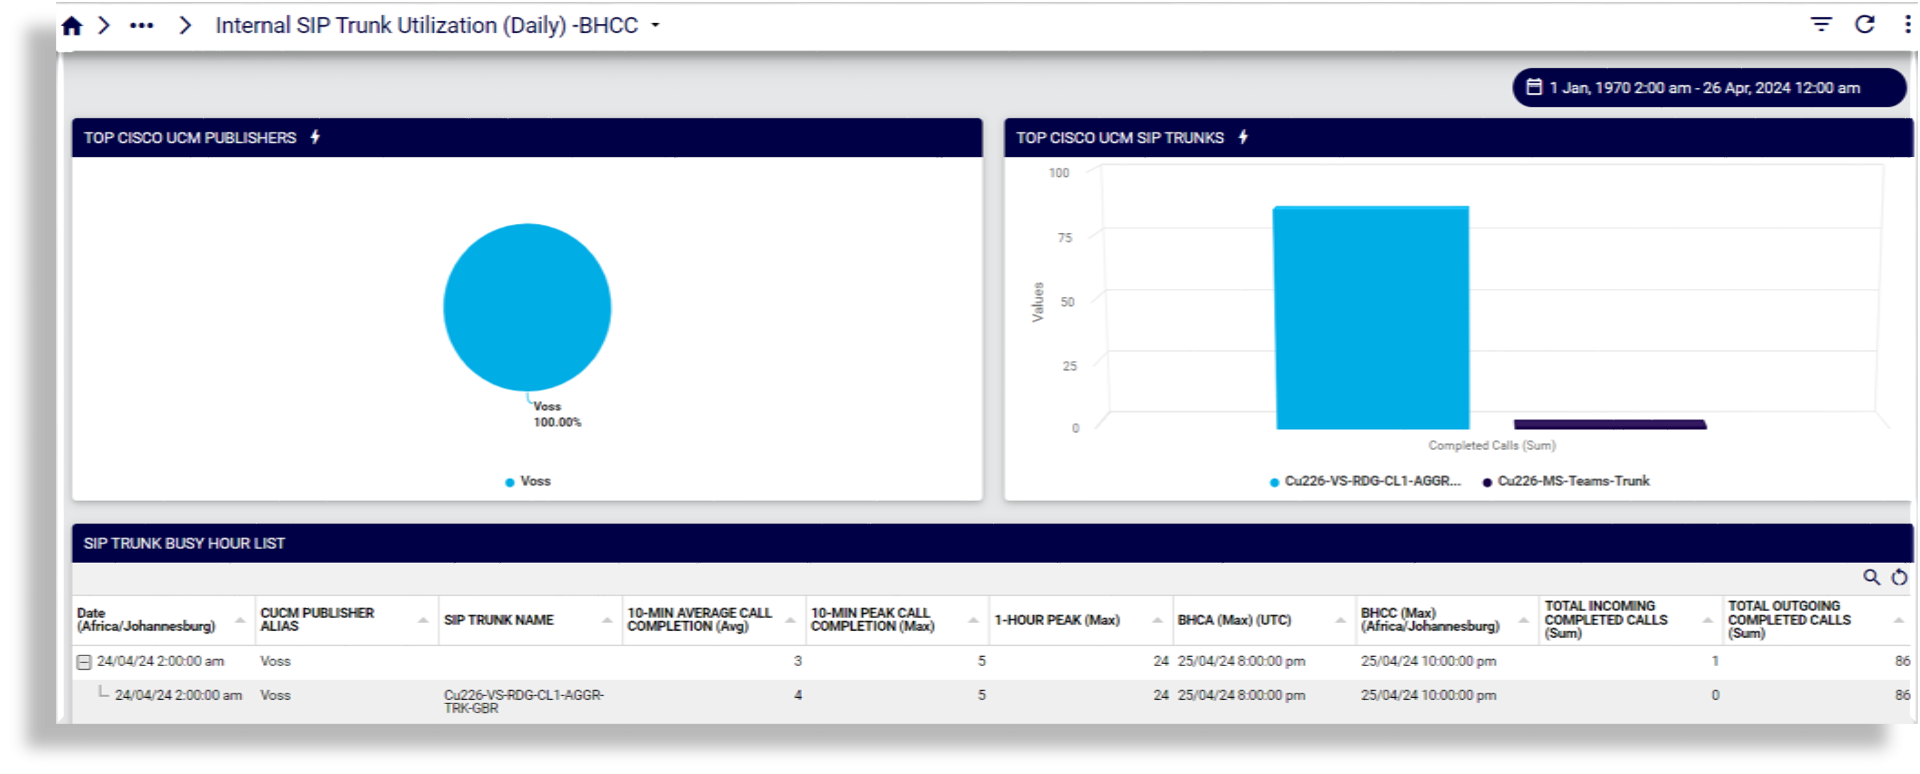
Internal SIP Trunk Utilization (Daily) -BHCC
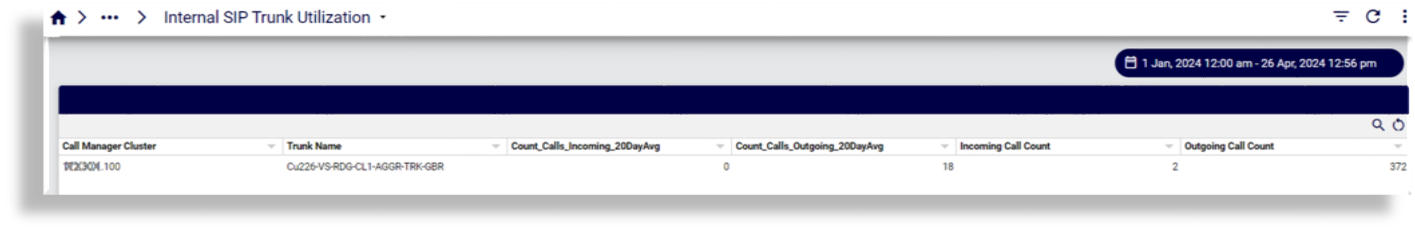
Internal SIP Trunk Utilization
Cisco Call Analysis > CUBE CDR#
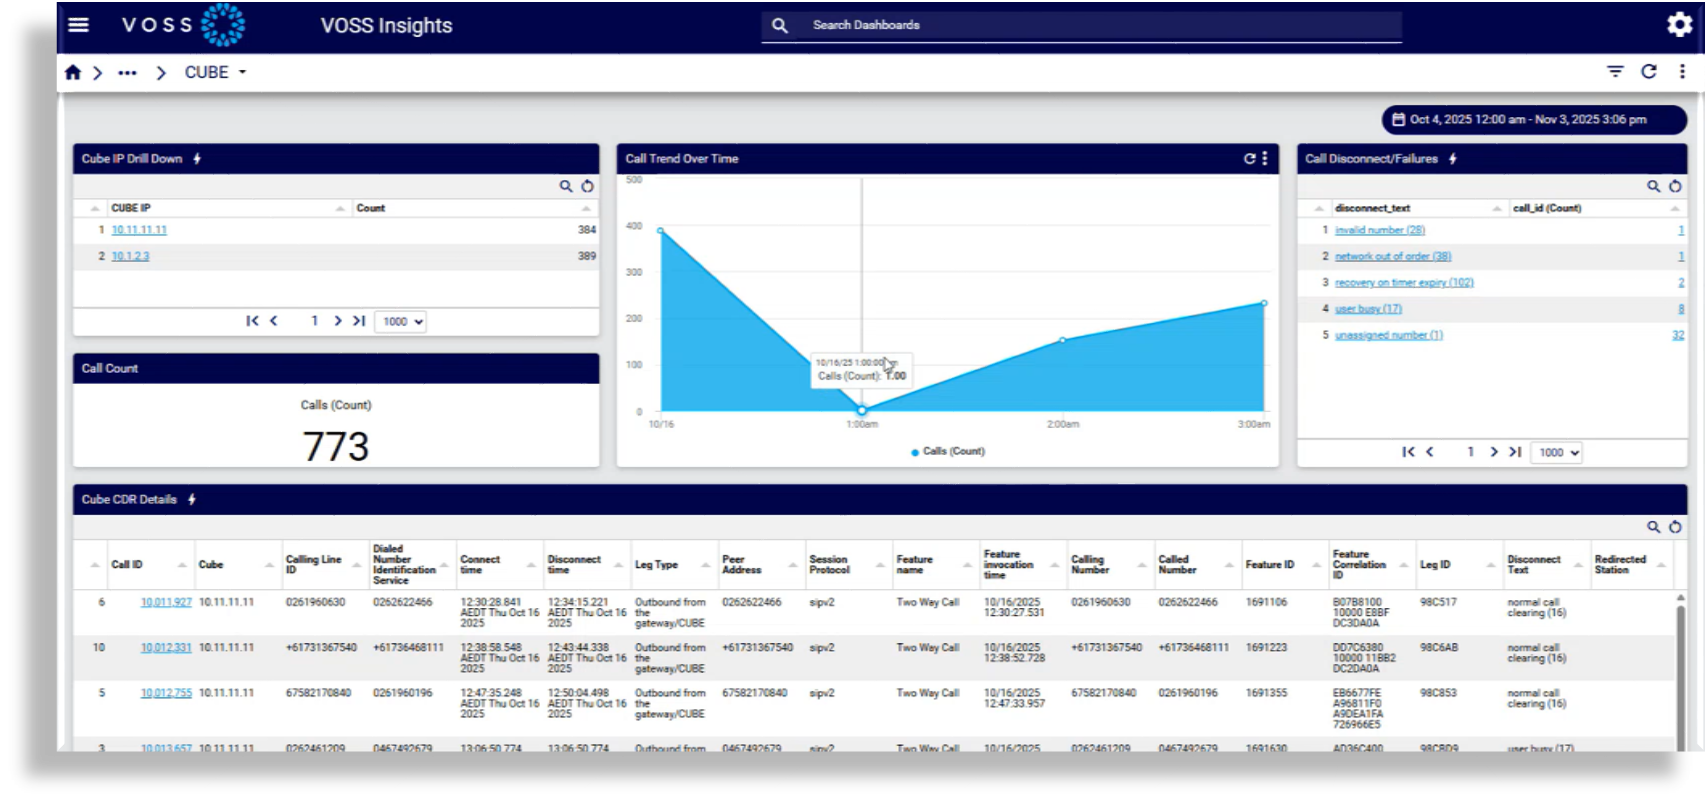
The Cisco Unified Border Element (CUBE) dashboard displays data for Call Data Record (CDR) ingestion and monitoring, allowing admins to monitor call volumes, patterns, and failure conditions originating from or terminating at a CUBE. This dashboard allows you to detect anomalies and gaps in service delivery across the UC estate, including interconnect points between internal and external networks and correlate CUBE data with upstream UC platforms, such as Cisco UCM or Genesys, for troubleshooting and service-level reporting.
Note
The setup required to show parsed CDR data on the CUBE dashboard is the following:
Once CDRs arrive in the CUBE folders on Arbitrator, the Arbitrator parses the data and the CUBE dashboard starts displaying data within minutes.
Displayed data on the CUBE dashboard includes:
The number of calls processed, per IP address and a total
Call trends over time
Failures
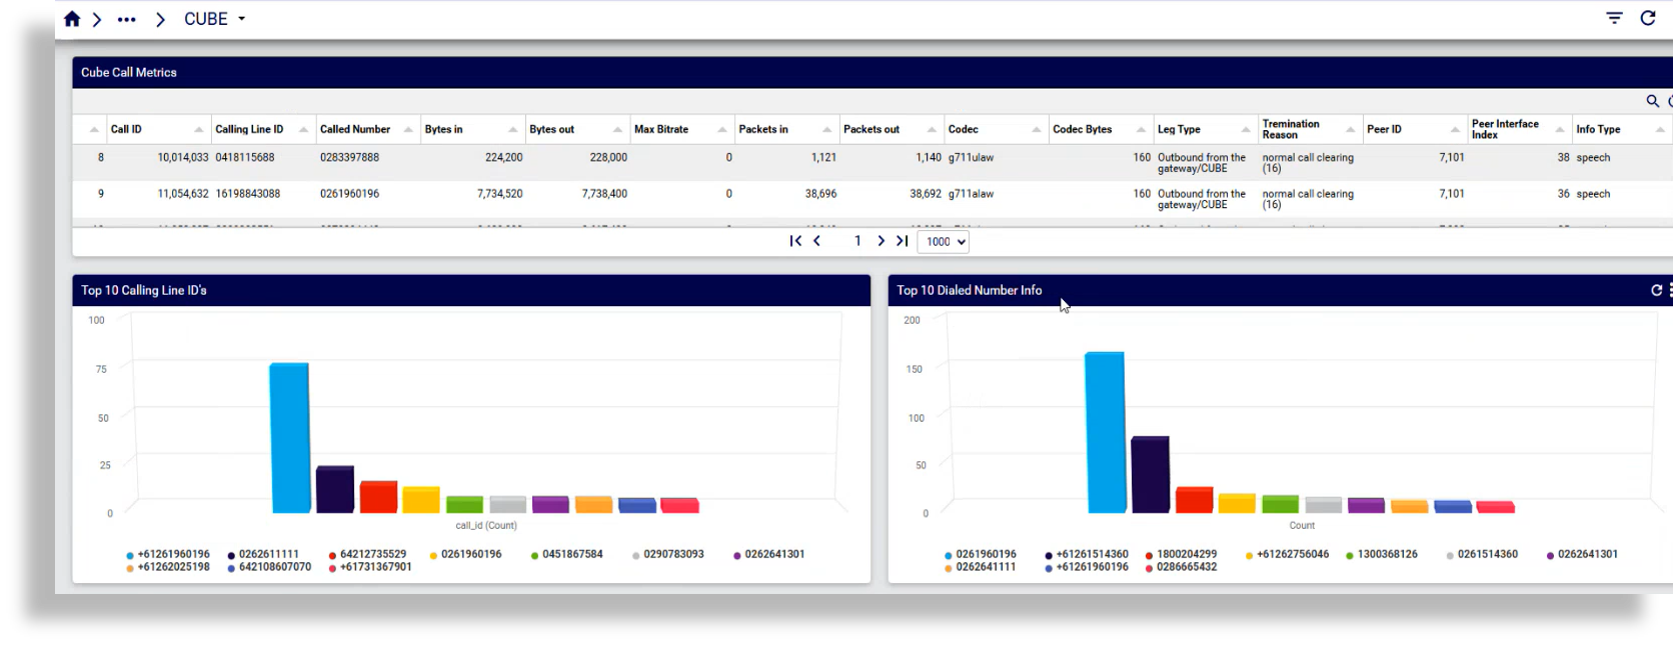
CDRs and CUBE call metrics
Top 10 calling line IDs
Top 10 dialed numbers
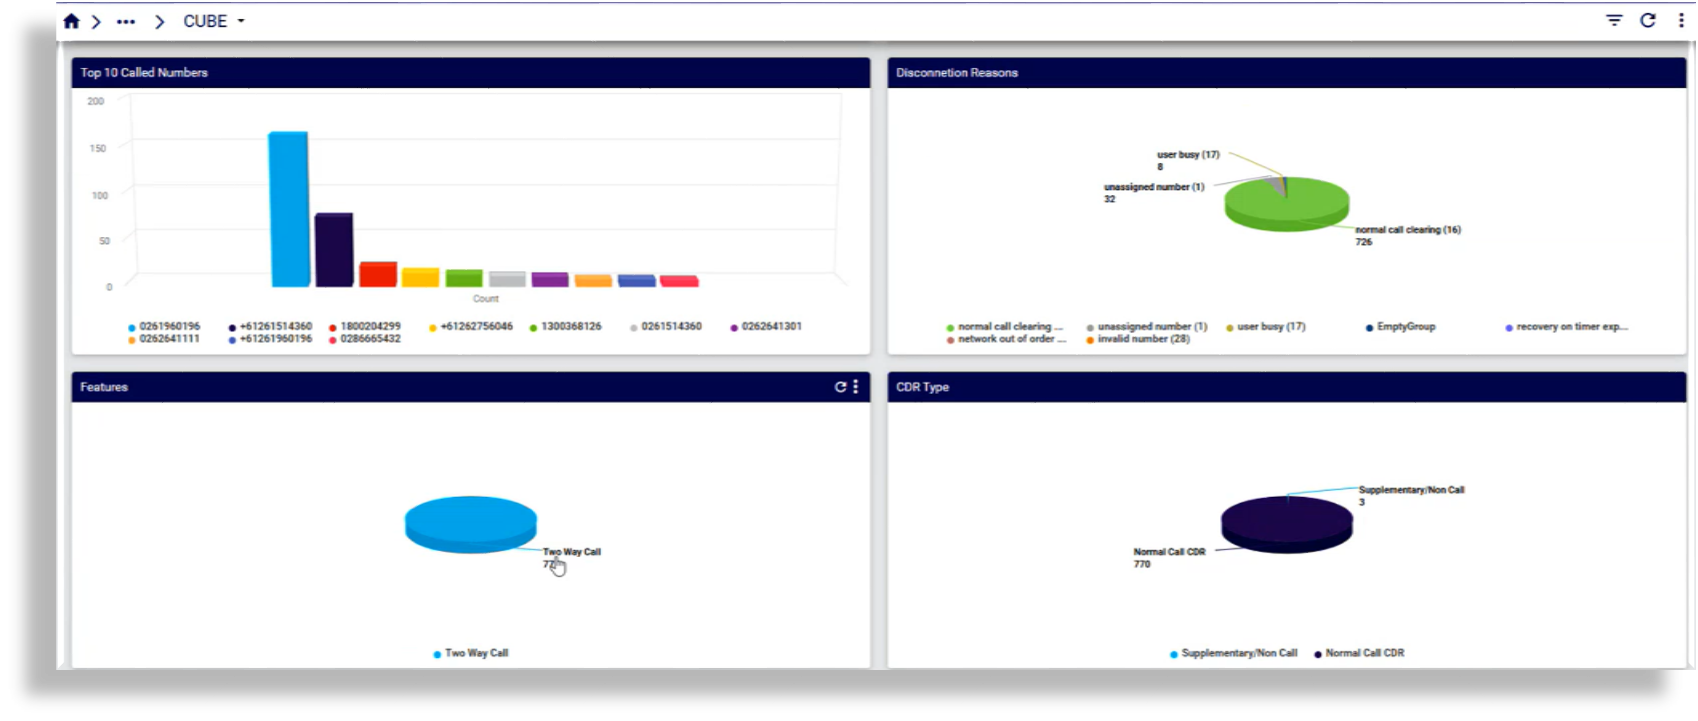
Top 10 called numbers
Disconnection reasons
Features used
Whether the CDR was normal or supplementary
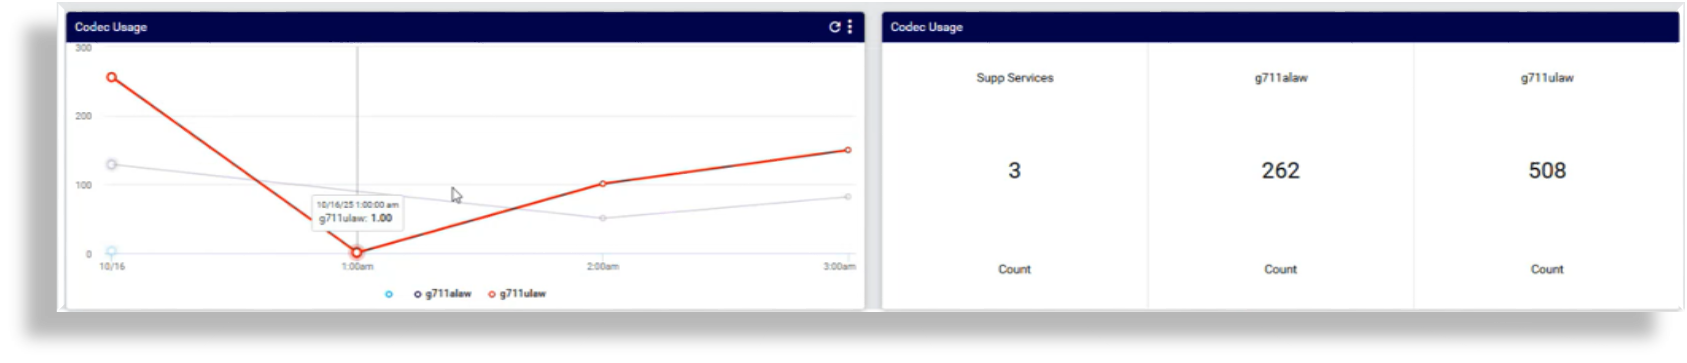
Codecs used, and trends
Ability to drill down on an IP to view details on all its calls
Drill down on call disconnect/failures to view details of invalid numbers
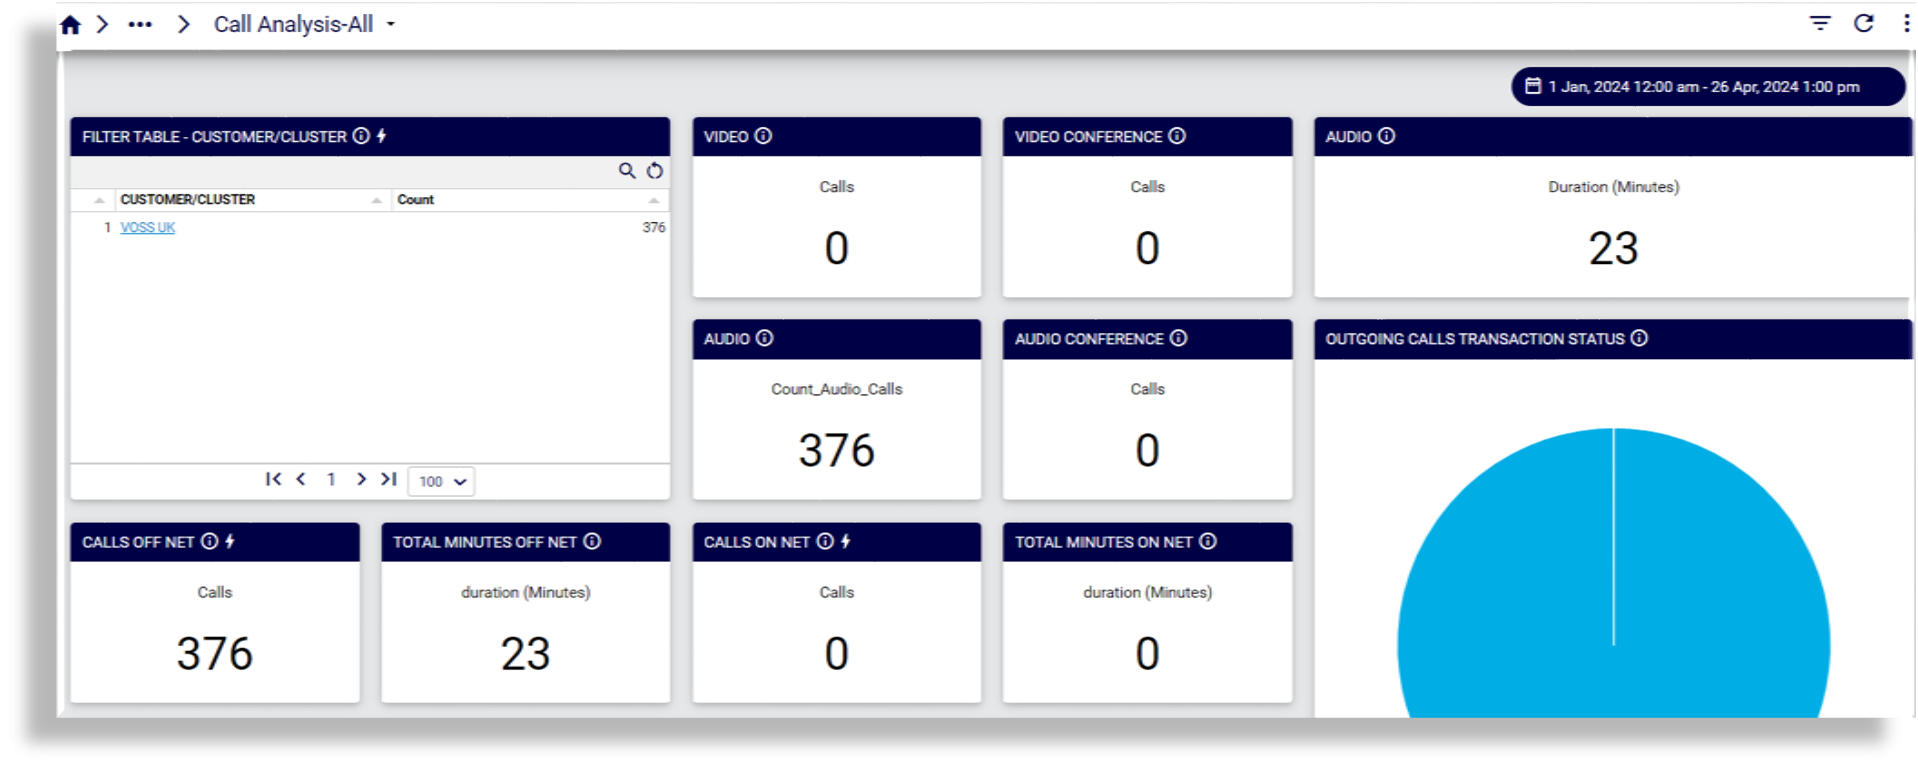
Cisco Call Analysis > Call Analysis All#
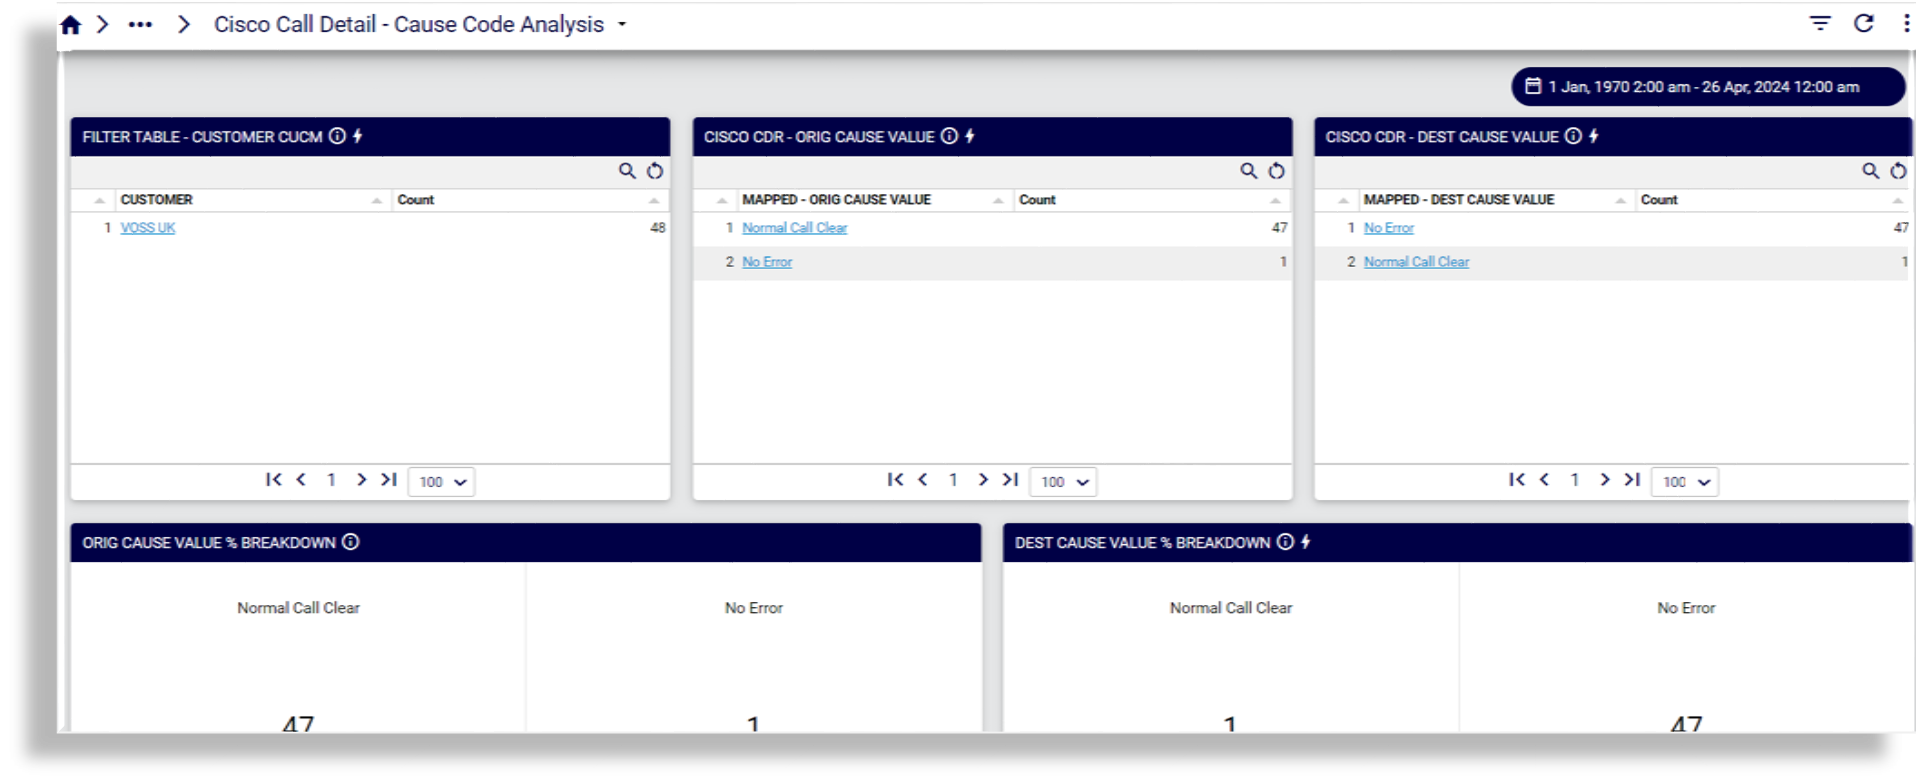
Cisco Call Analysis > Cisco Call Detail - Cause Code Analysis#
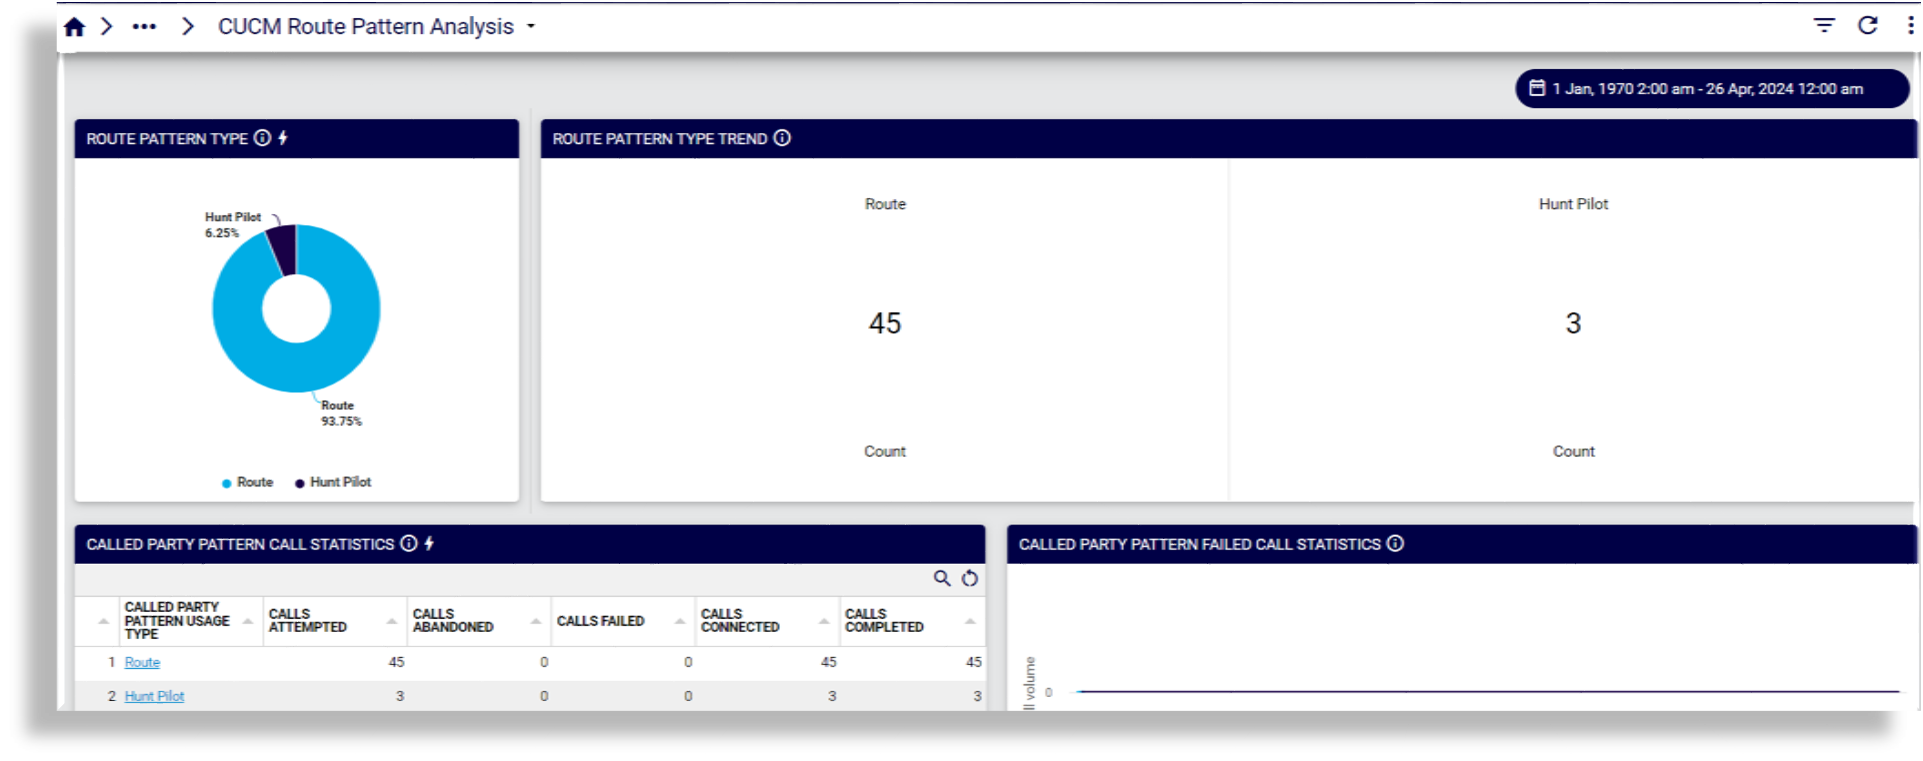
Cisco Call Analysis > CUCM Route Pattern Analysis#
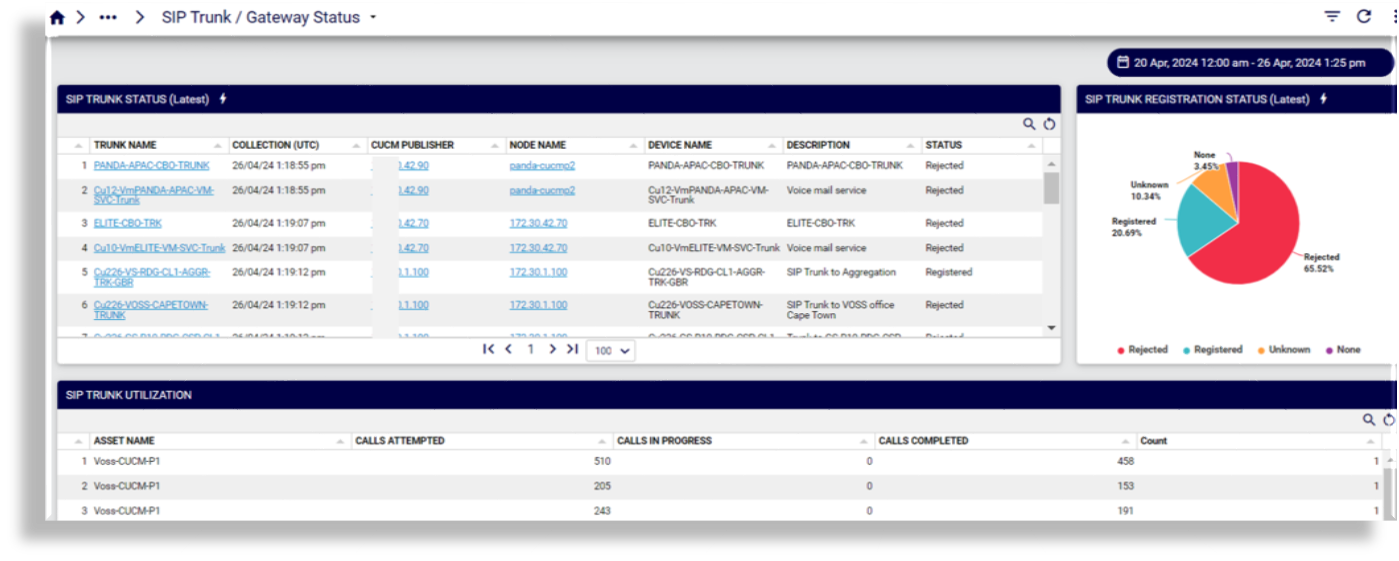
Cisco Call Analysis > SIP Trunk / Gateway Status#
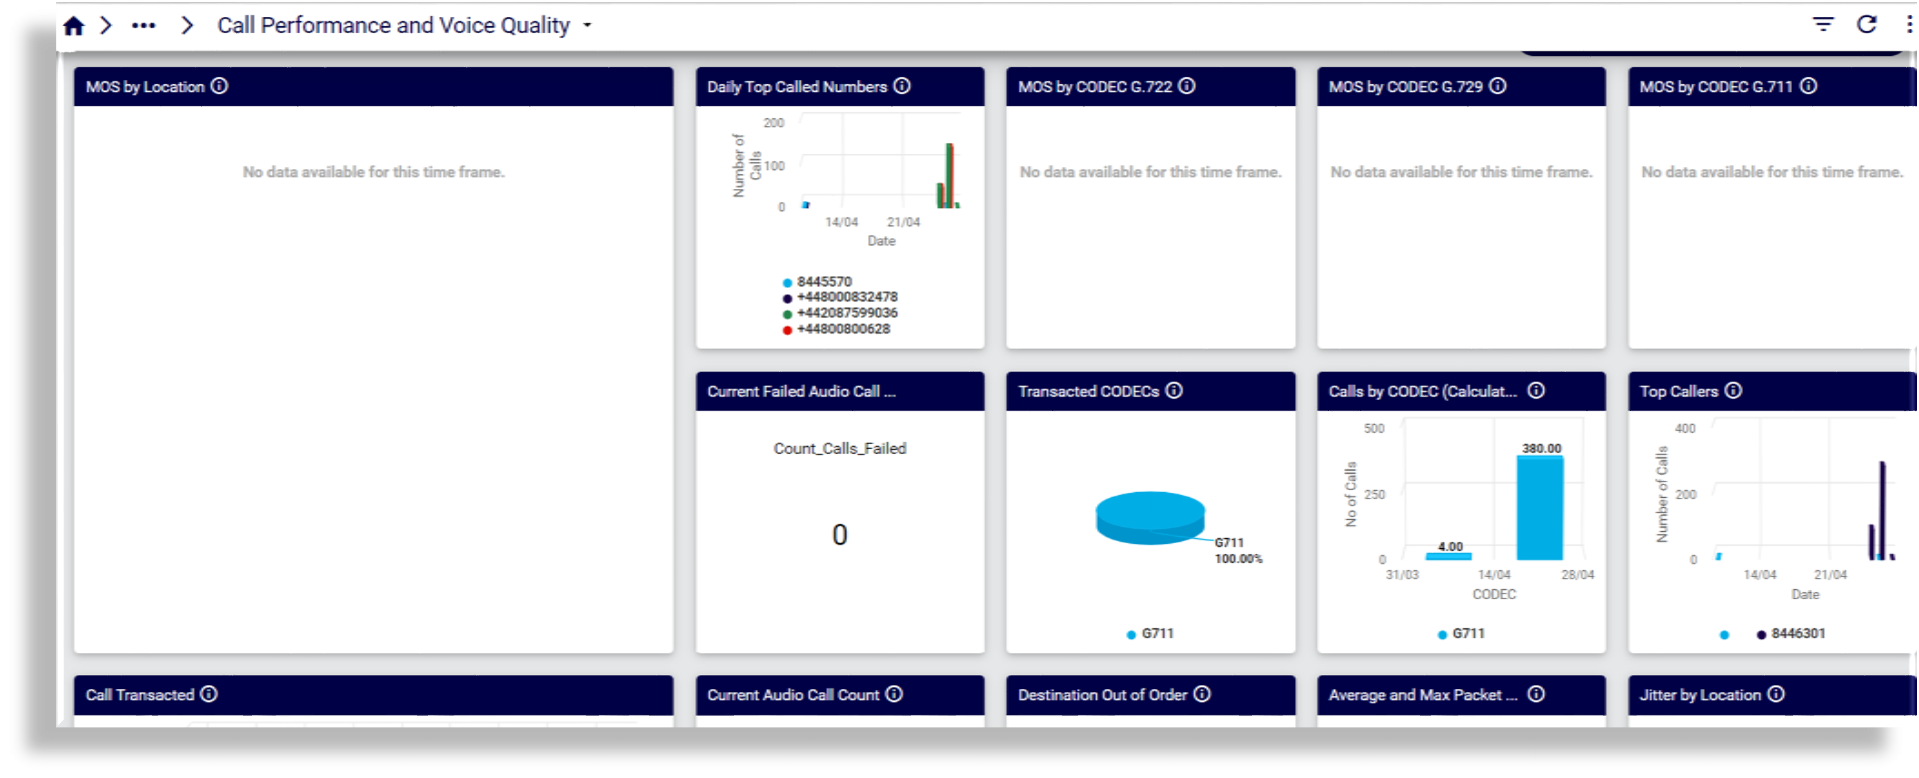
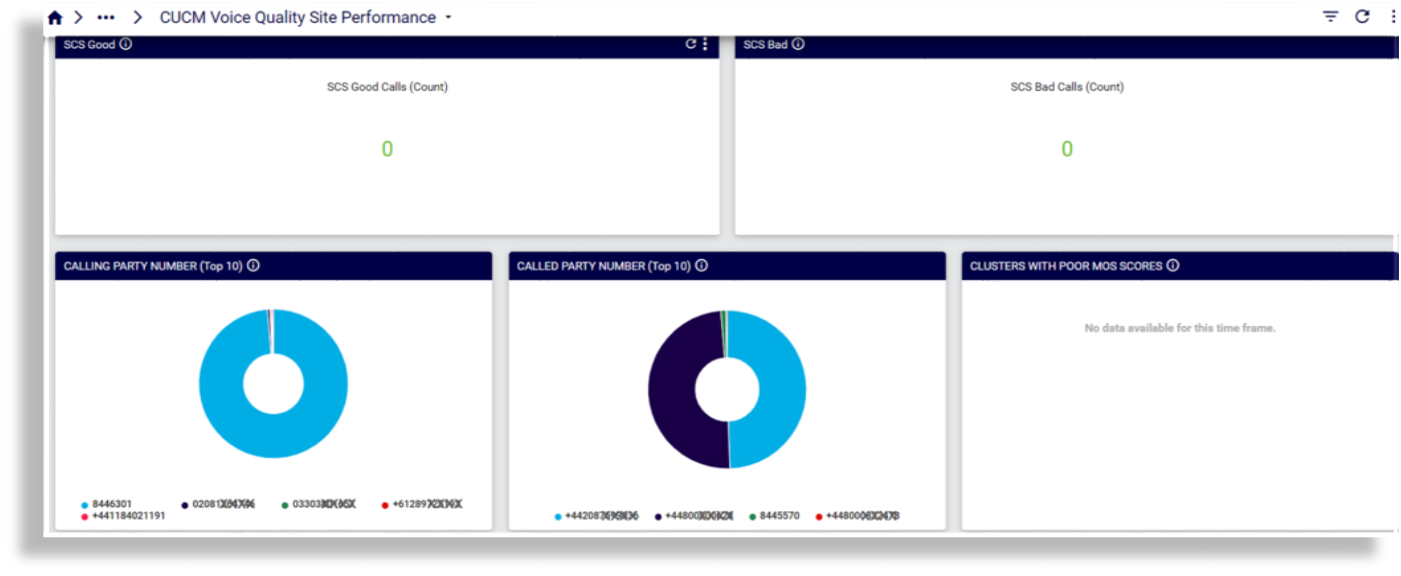
Cisco Call Quality#
Call Performance and Voice Quality
CUCM Voice Quality Site Performance
Microsoft#
Microsoft Teams dashboards display various data for understanding usage and overall health for a range of Microsoft Teams phones devices, including PSTN call records, and greater detail for Teamwork devices.
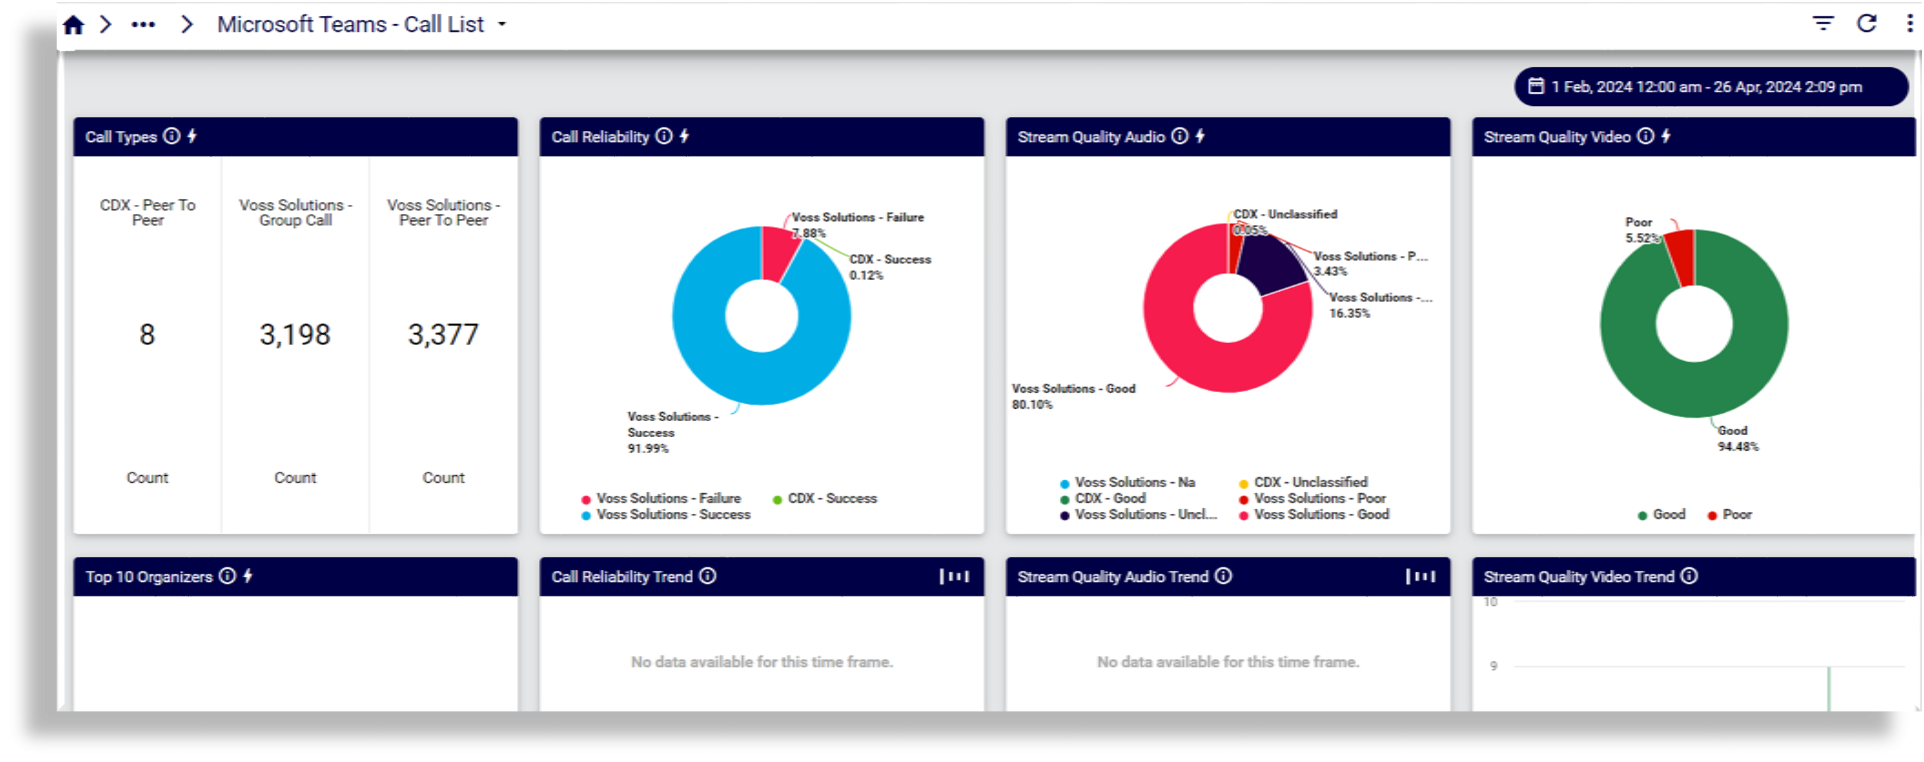
Call List
Reports on vendor, call type, list and error, modality and quality. Clicking on a user opens the Call Debug Compact dashboard to view call statistics and incident detection and details for that user’s call.
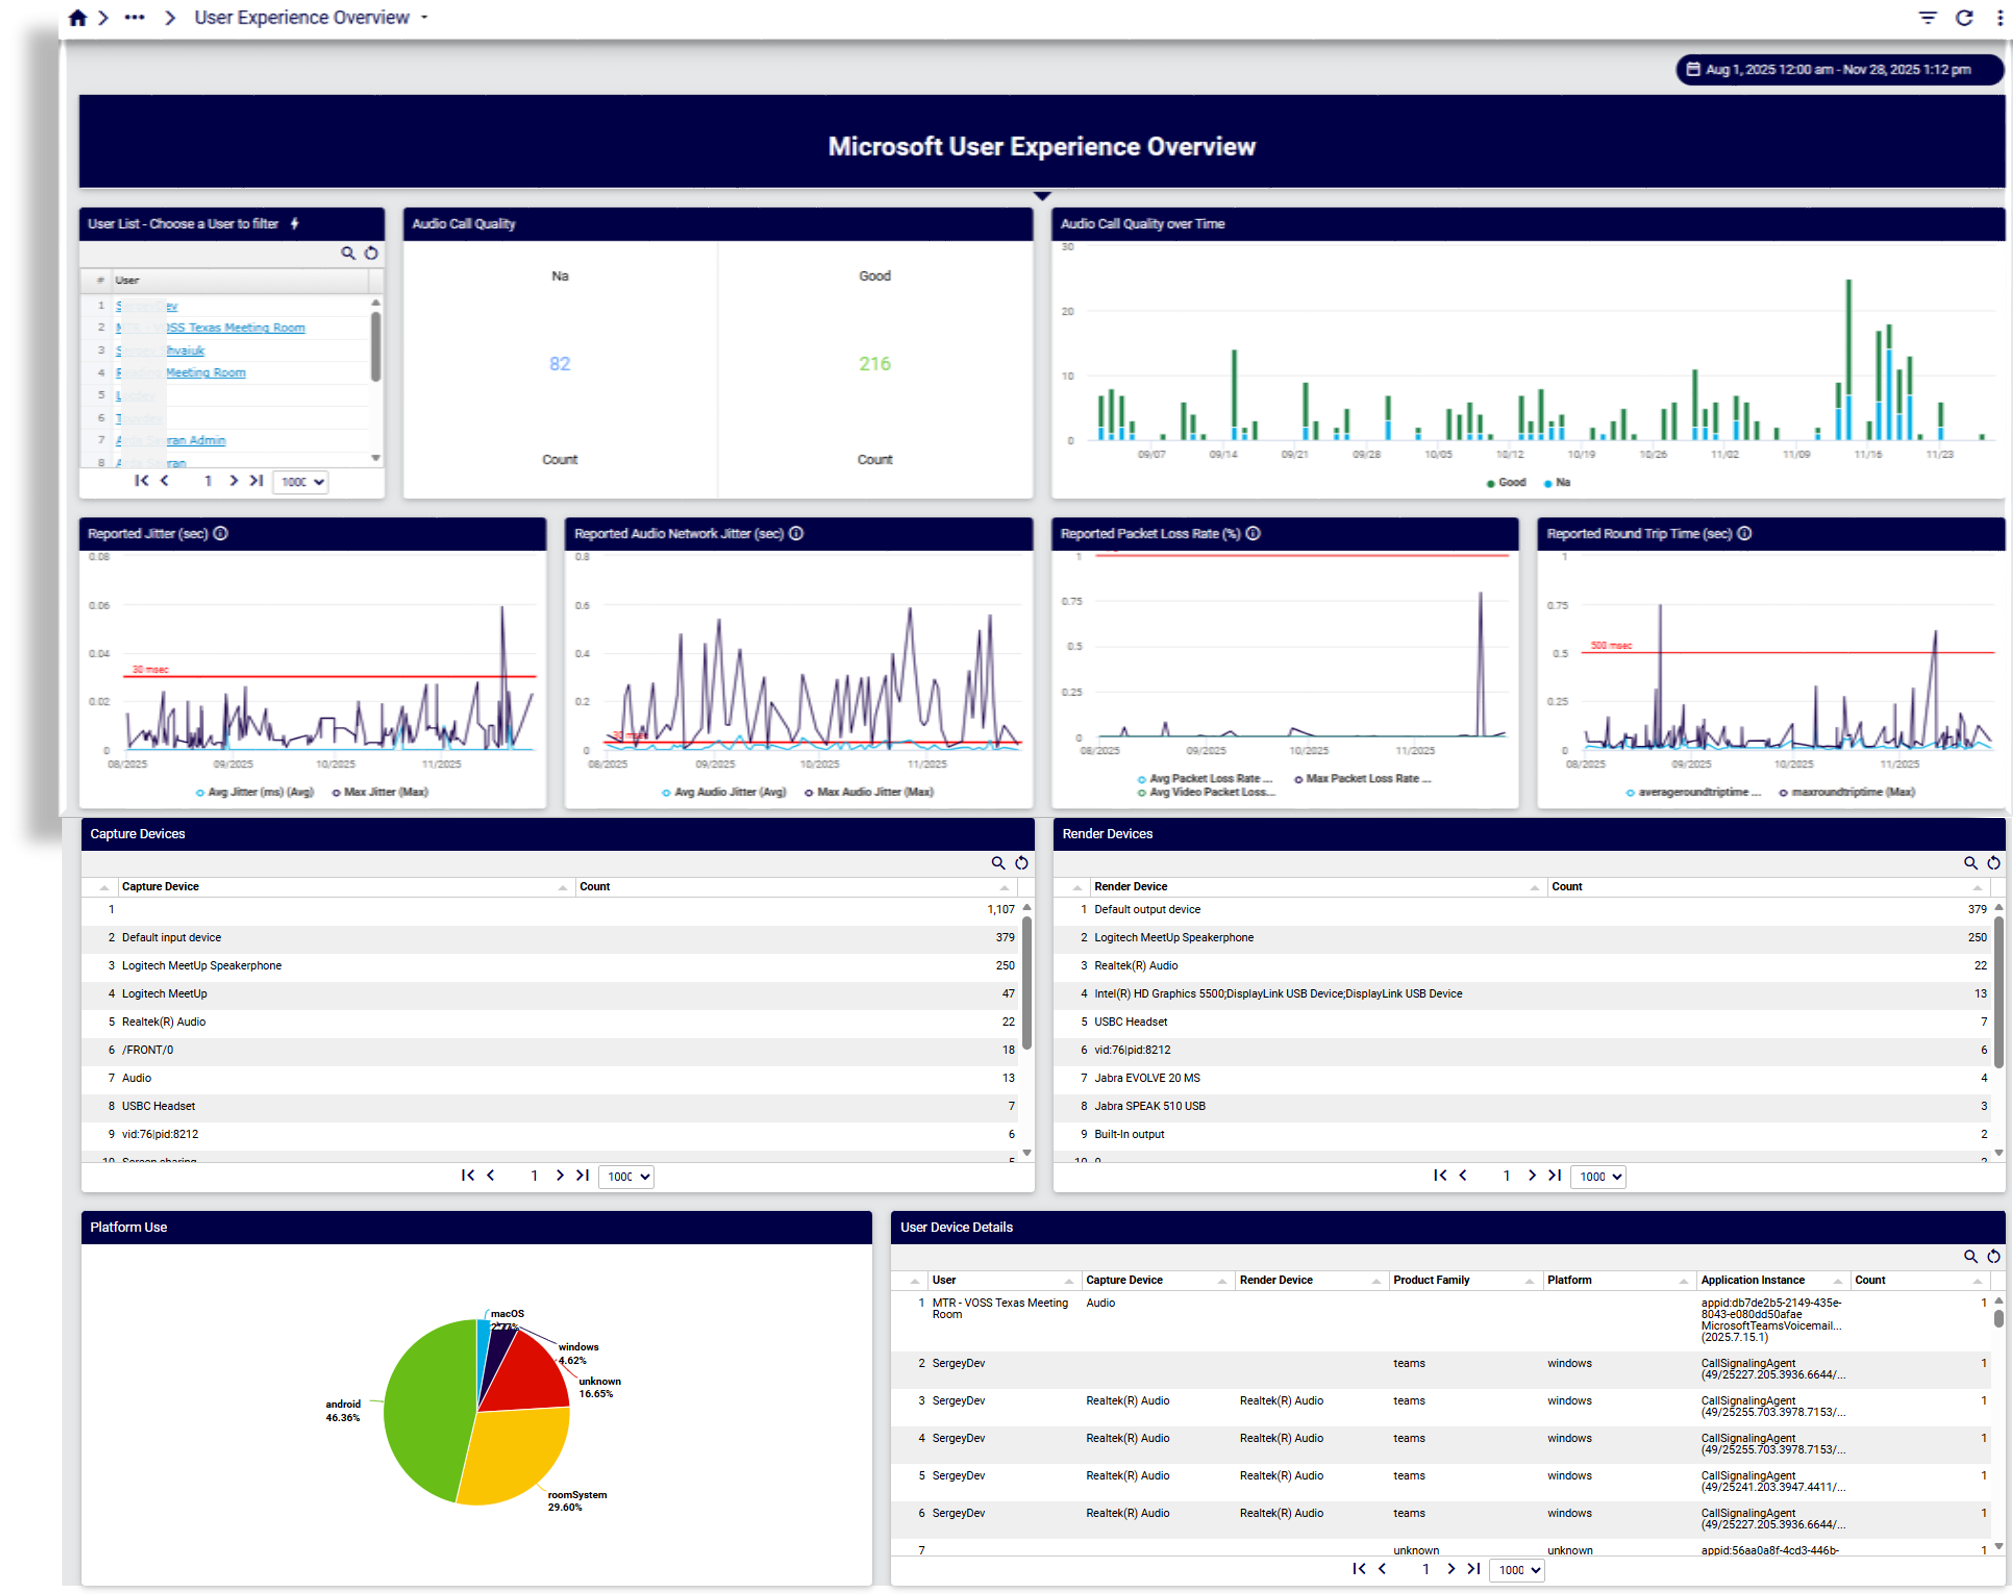
User Experience Overview
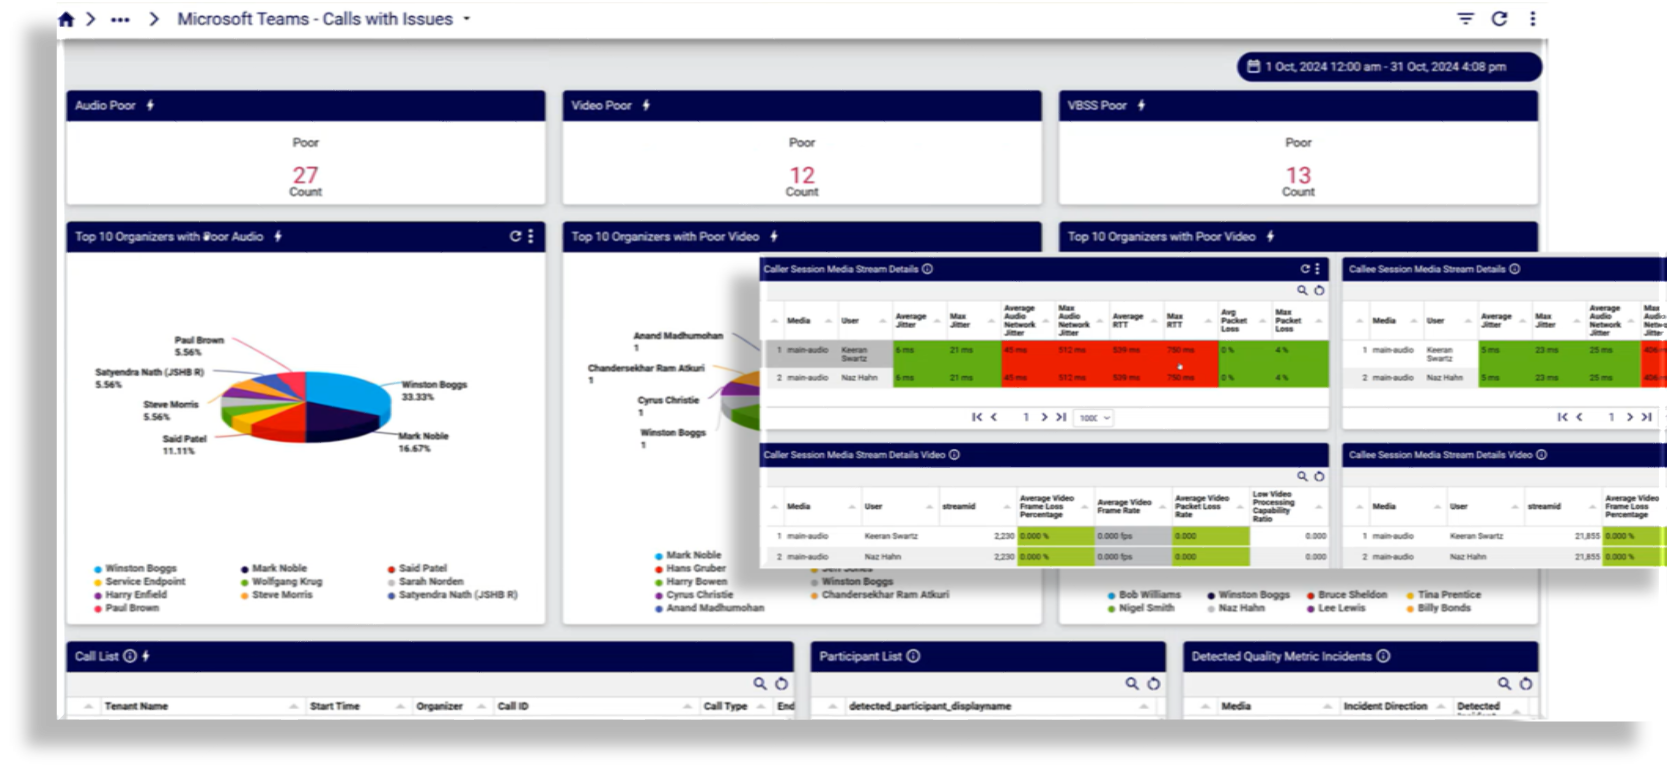
Calls with Issues
This dashboard provides a count of poor quality calls, by category, for example, audio or video, and allows you to drill down into specific calls to view quality statistics showing why the call was poor or failed.
Reports on call details, status, duration, quality, participant list, user agent details (caller and callee), failures by subnet/location.
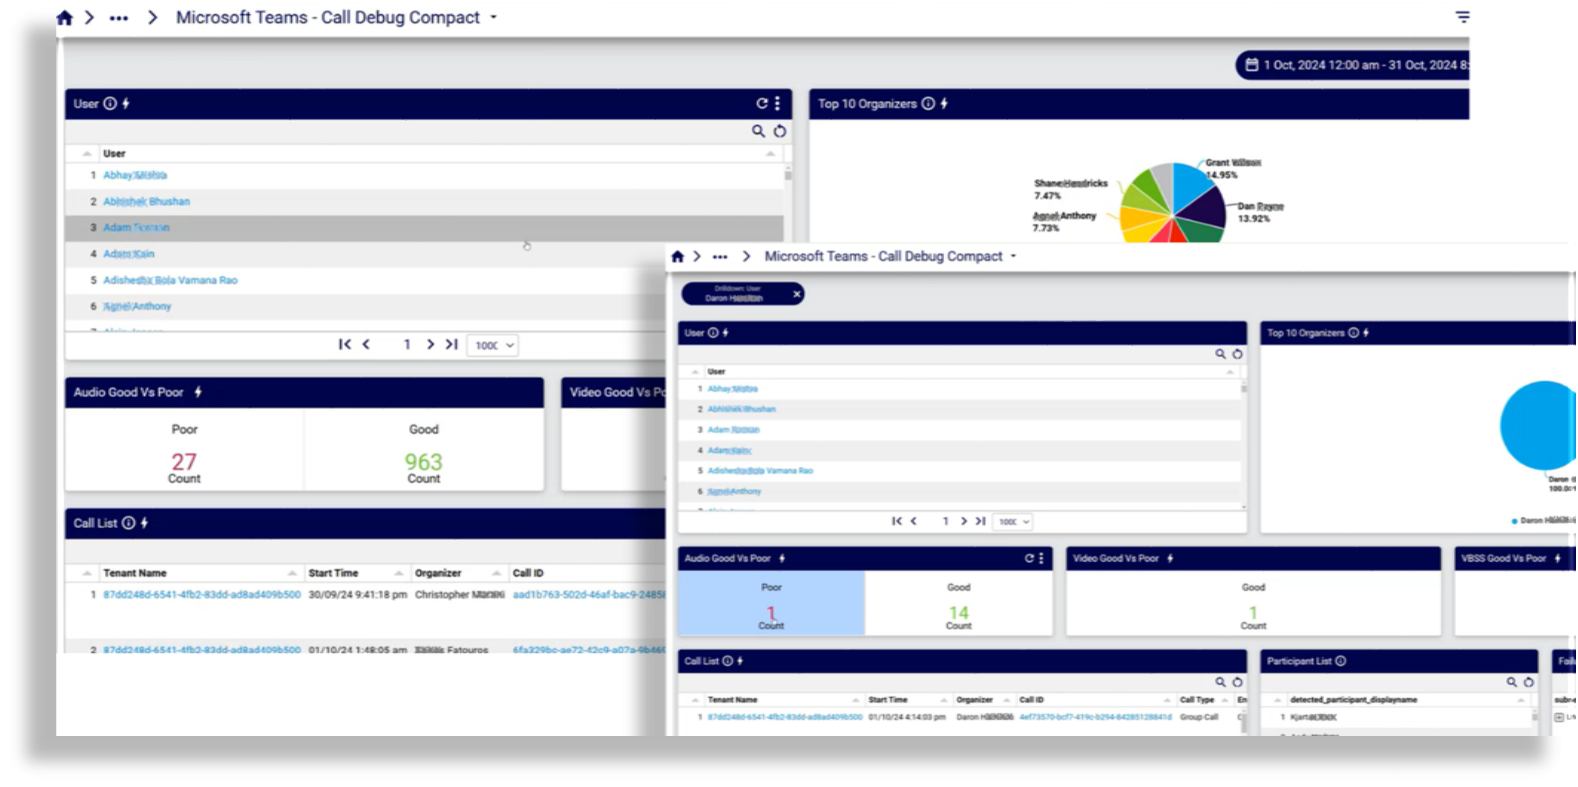
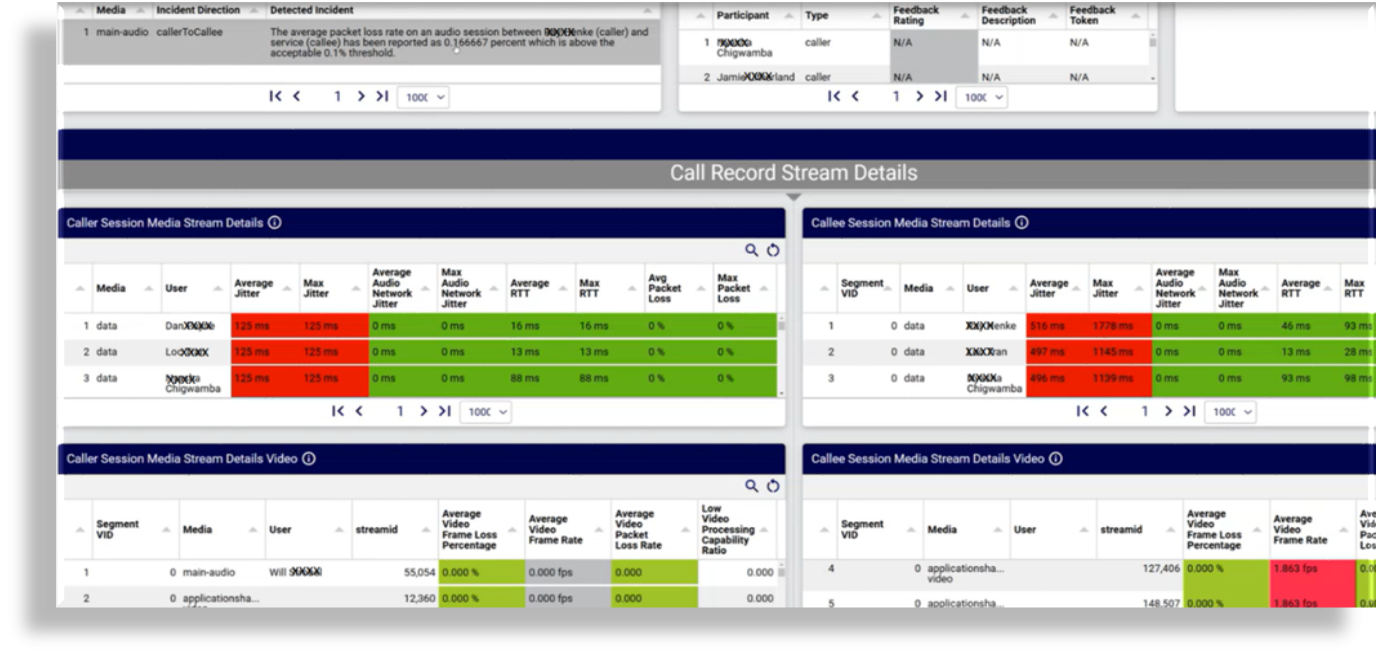
Call Debug Compact
A user-centric dashboard to investigate call quality for specific users. This dashboard allows an admin or helpdesk support person to drill down to a user’s calls, and to drill down to detected incidents on a specific call to understand exactly why a call failed or had poor quality - for example, you can see immediately whether an error may be related to one or more of jitter, video frame rate, packet loss, or some other indicated issue.
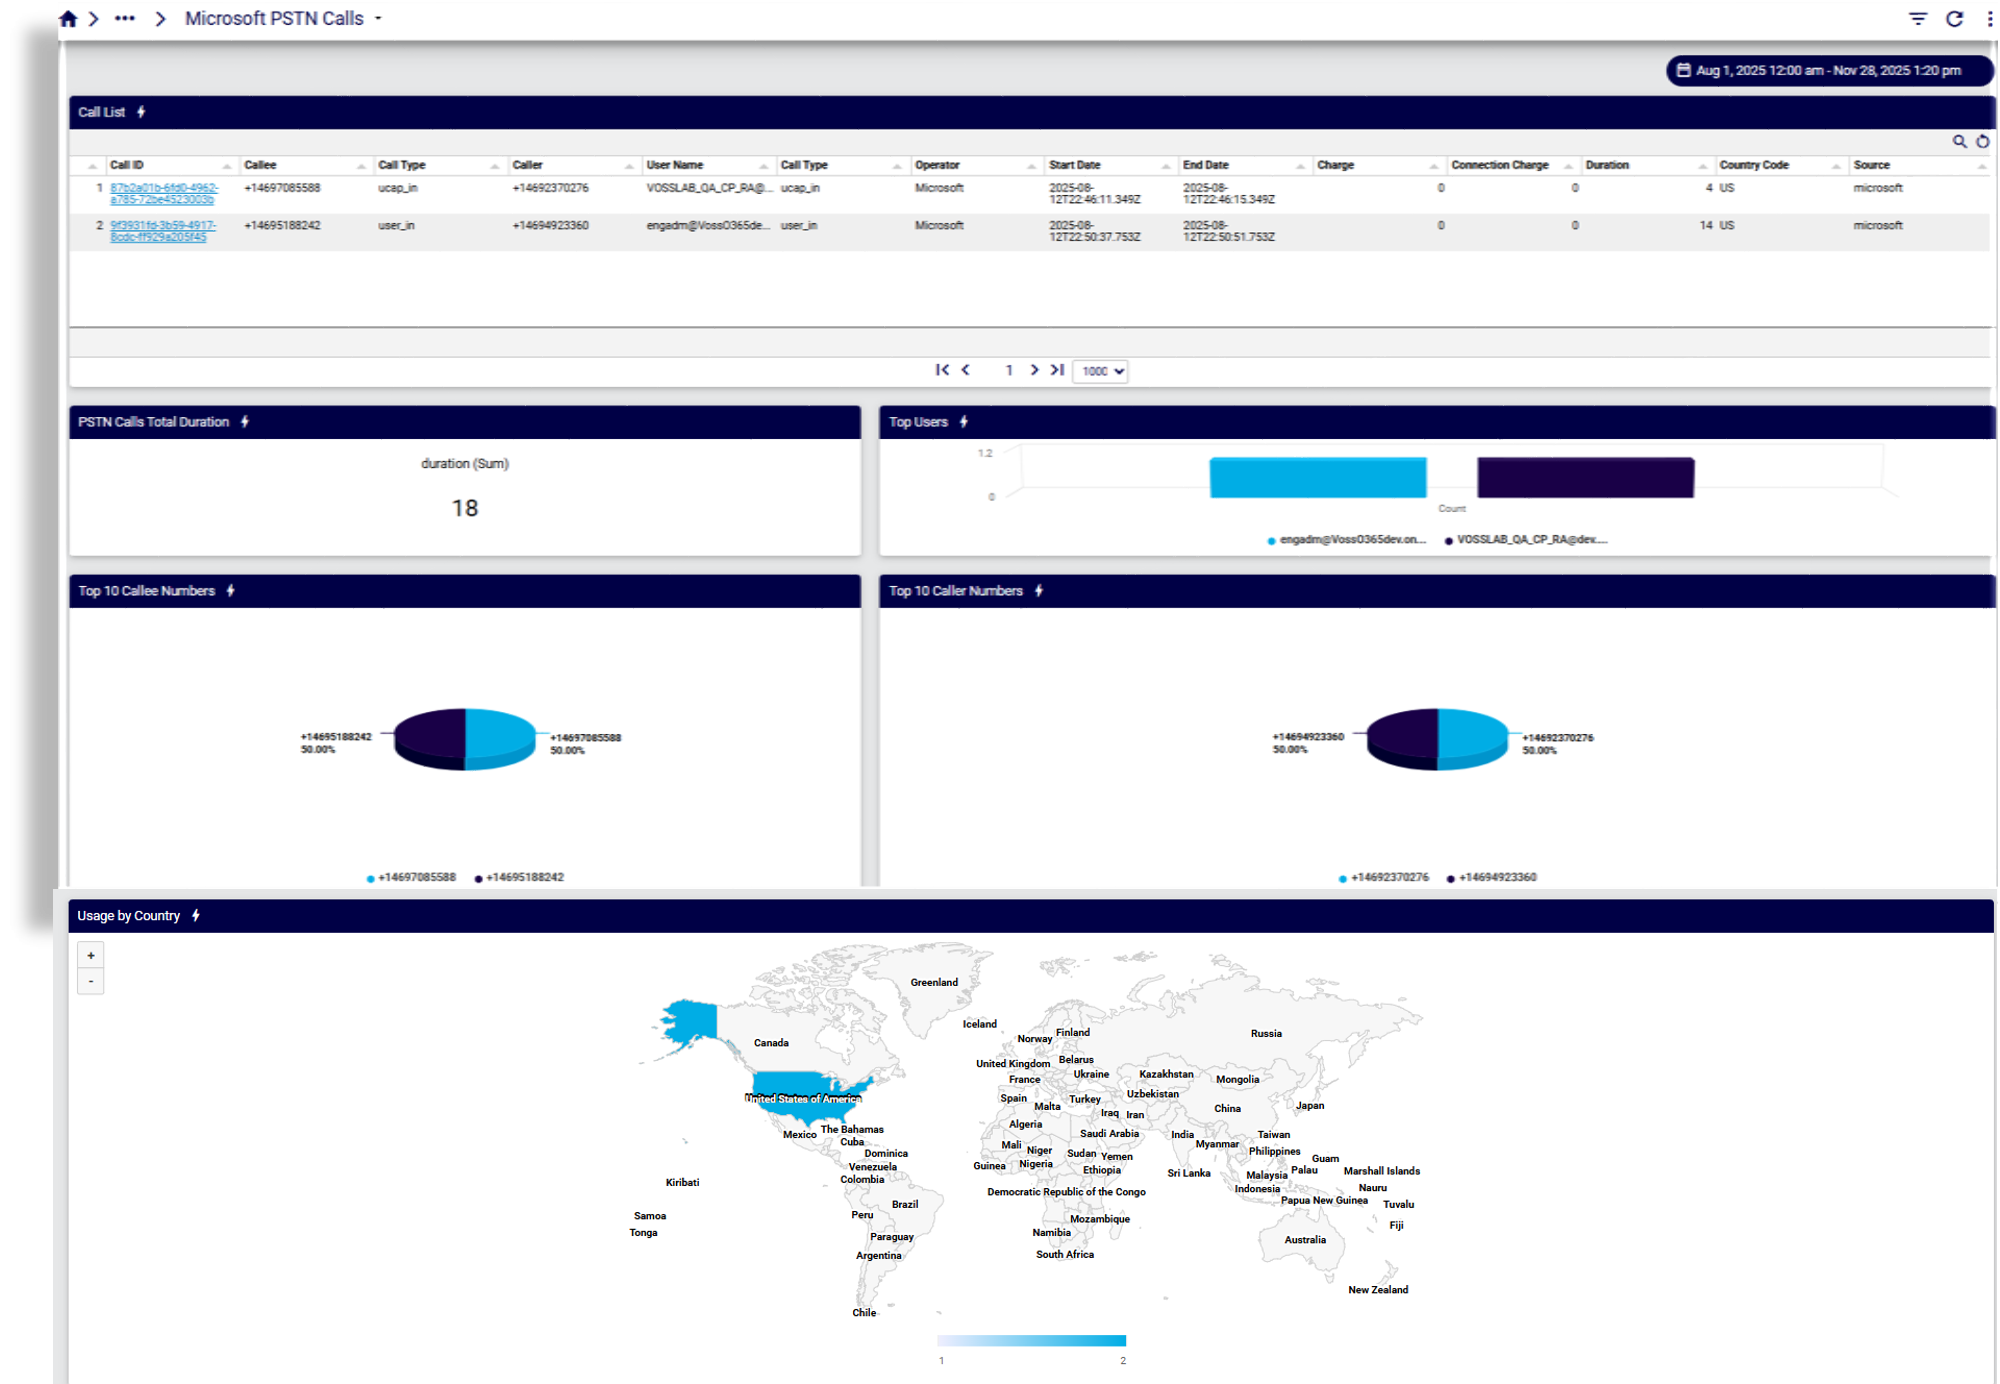
Microsoft PSTN Calls
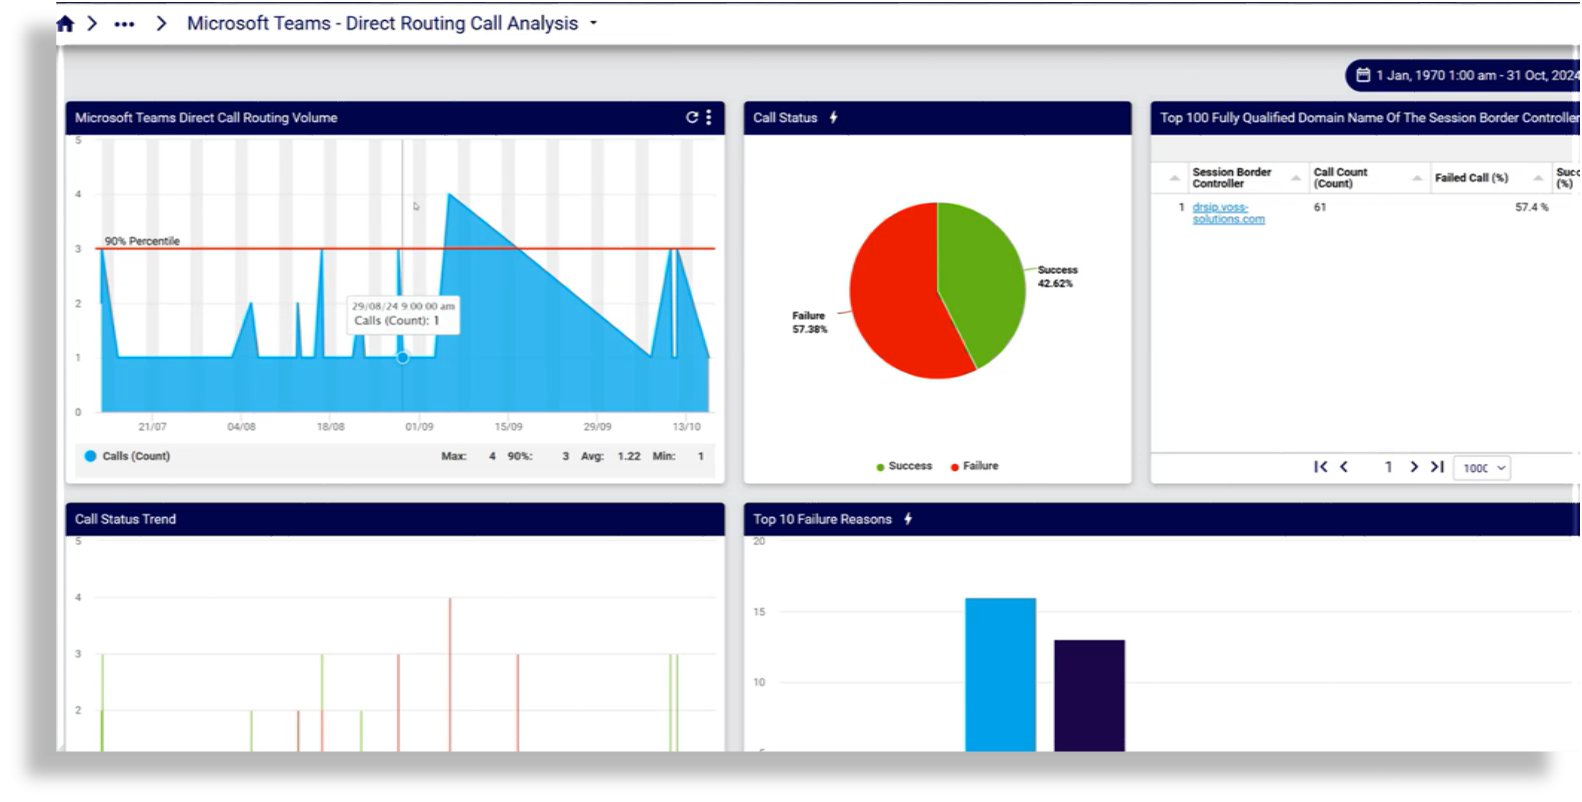
Direct Routing Call Analysis
This dashboard allows you to monitor the connectivity status between your SBC (Session Border Controller) and the direct routing interface so that you can track critical parameters related to your SBC, telephony service, and network conditions along the path to the direct routing interface. You can use details displayed on this dashboard to quickly detect and troubleshoot issues, including dropped calls.
To collect this data, your Microsoft tenant must be enabled for call collection. This is configured on the Arbitrator via System Configuration > Archive Management > Configuration Management > API Config.
Data includes details for the top ten failure reasons, top ten caller and callee numbers based on attempt, top ten caller and callee numbers based on duration, as well as the call list, which provides summary data and details per call.
By default, data is shown for the past two days, but can be configured to display data for a period not exceeding 90 days, which is the maximum period that Microsoft allows.
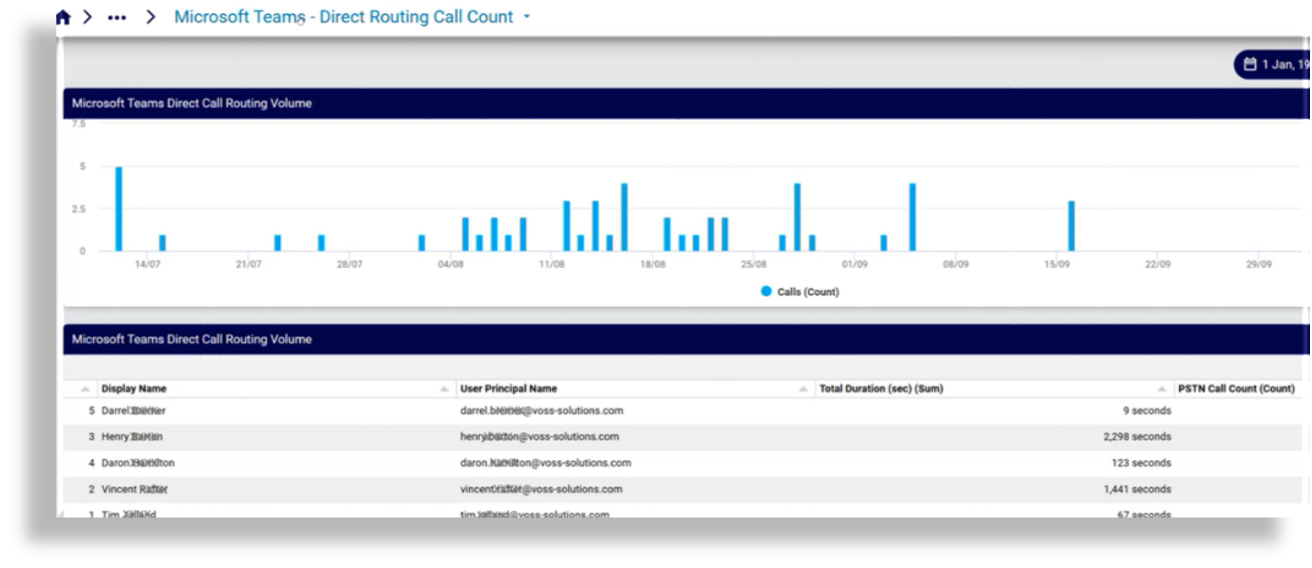
Direct Routing Call Count
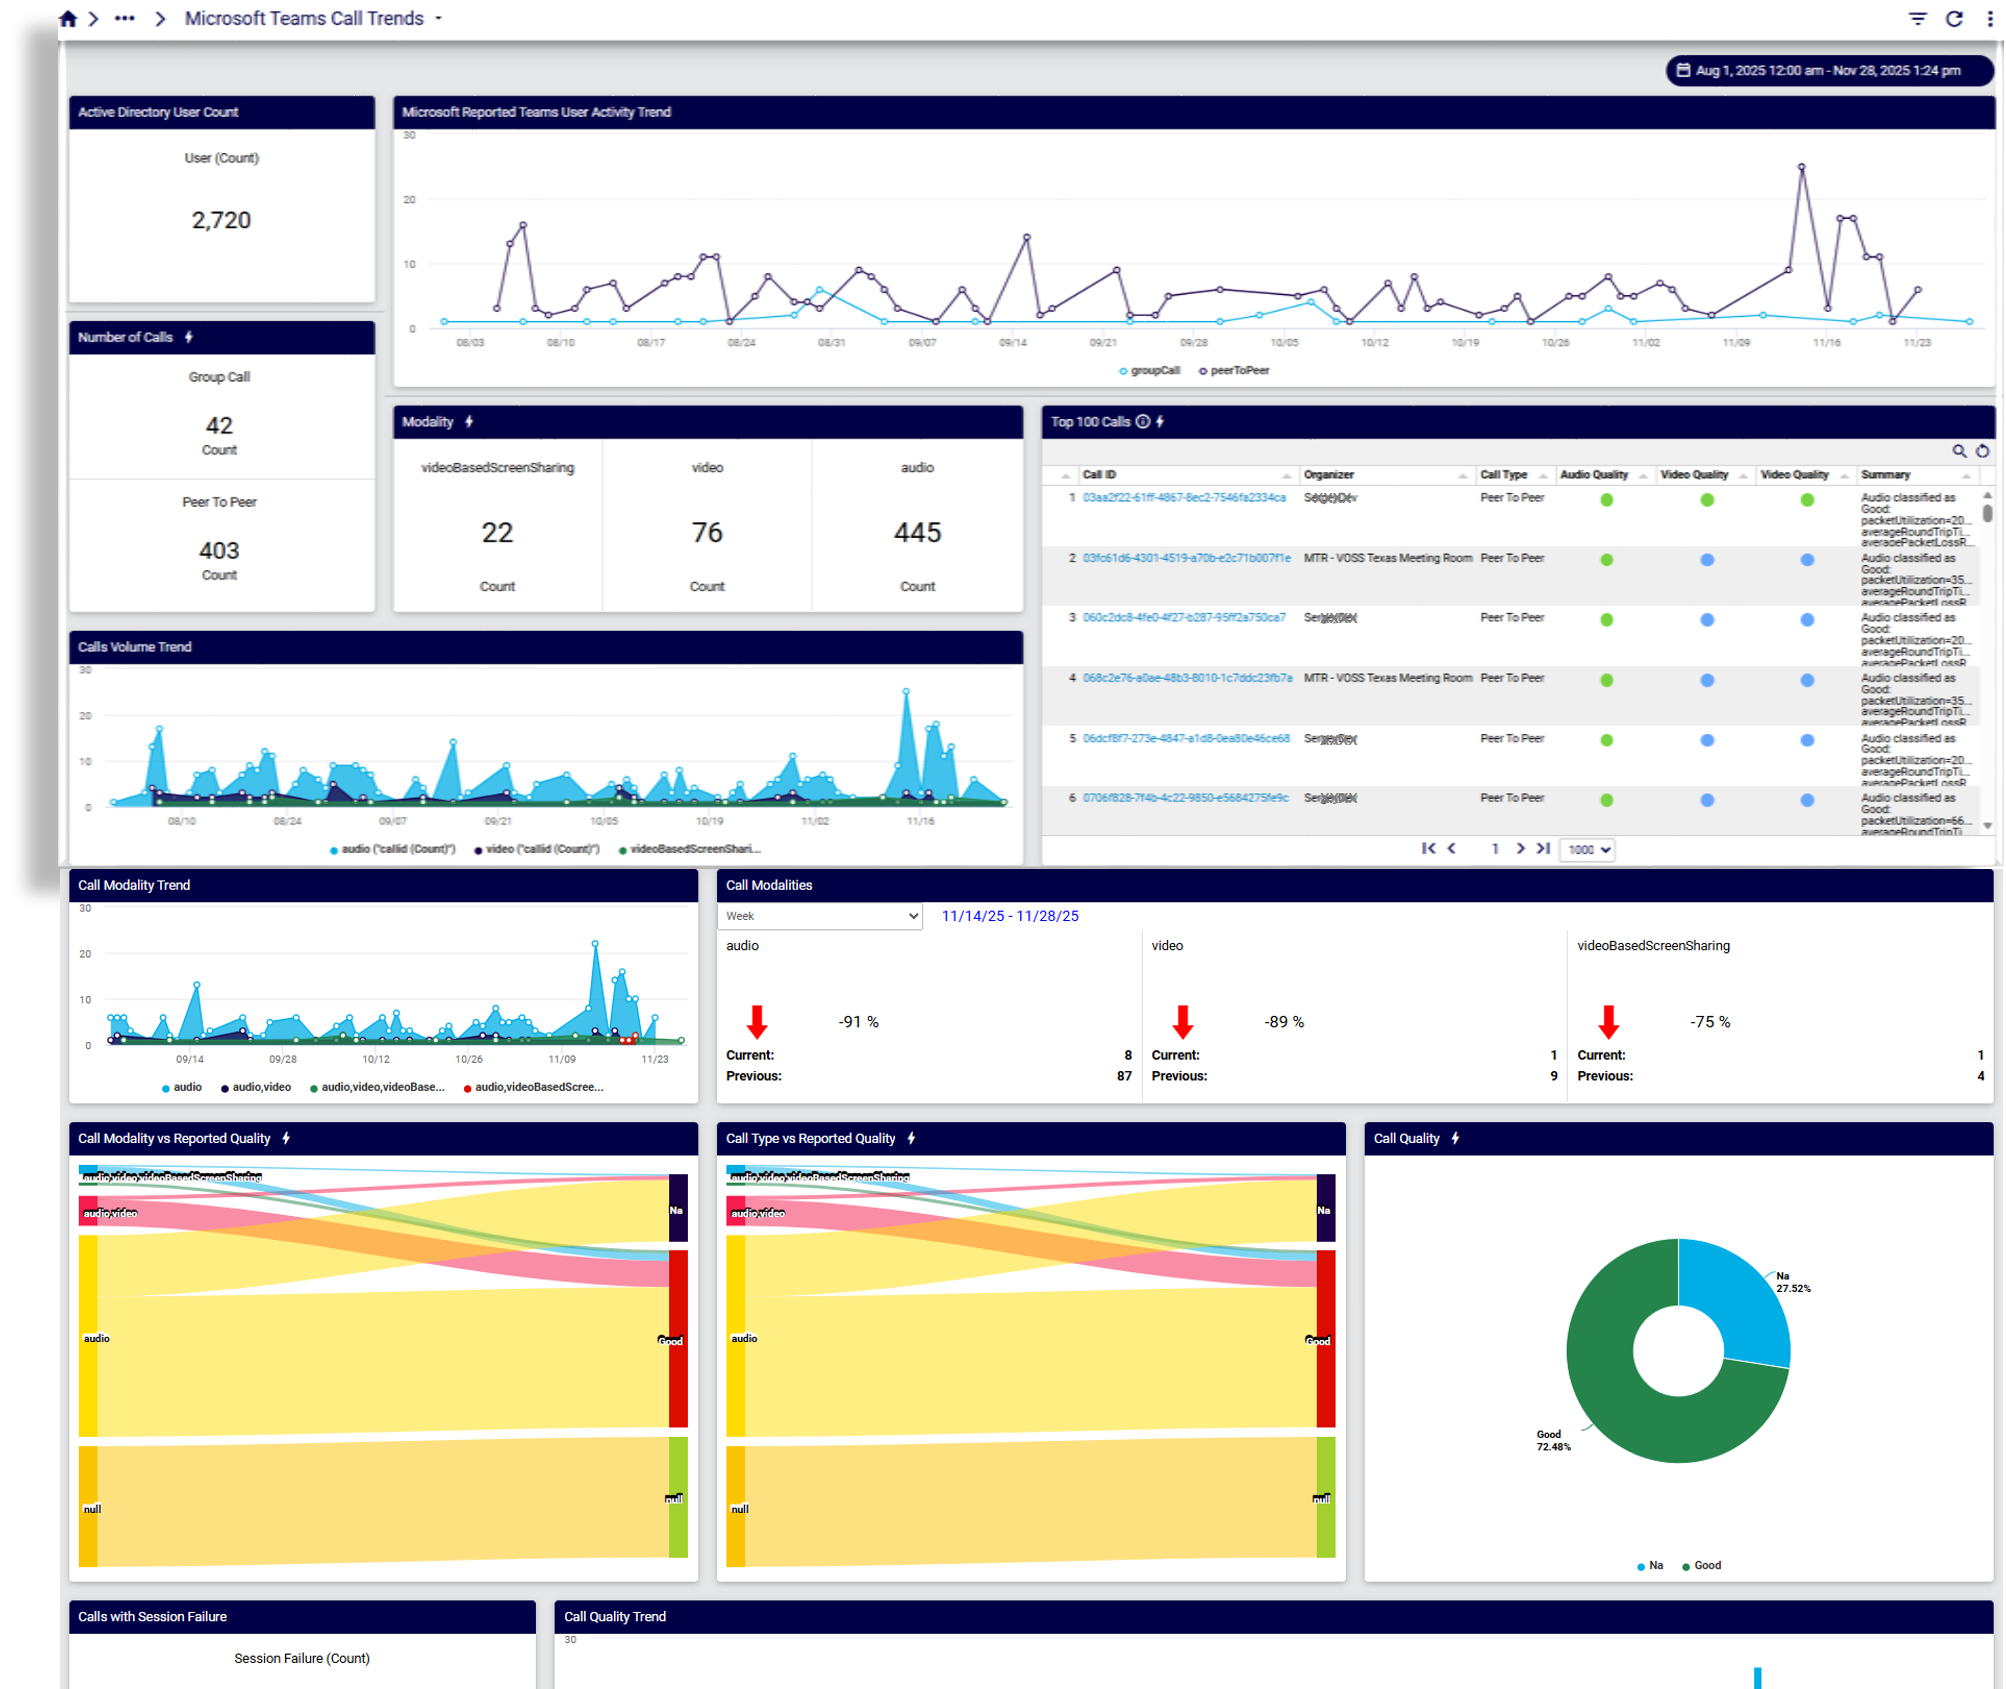
Microsoft Teams Call Trends
Microsoft Teams Call Feedback
This dashboard provides insights into user sentiment via feedback ratings provided by users when prompted by MS Teams:
Call ratings
Ratings over time (trends)
Users surveyed
UA over time
UA/OS ratings
Synthetic Transactions Dashboards#
These dashboards present data that allows you to understand why events such as packet loss are occurring, and to monitor performance indicators on router interfaces.
The dashboards are based on agents that can be deployed anywhere in a customer’s network, provided they can contact the Arbitrator, and allow monitoring of Linux systems. For details on installing agents, see the topic on Digital Experience Monitoring (DEM) Agent Installation in the Arbitrator Install Guide.
Related topics:
DEM Agent Stats Overview
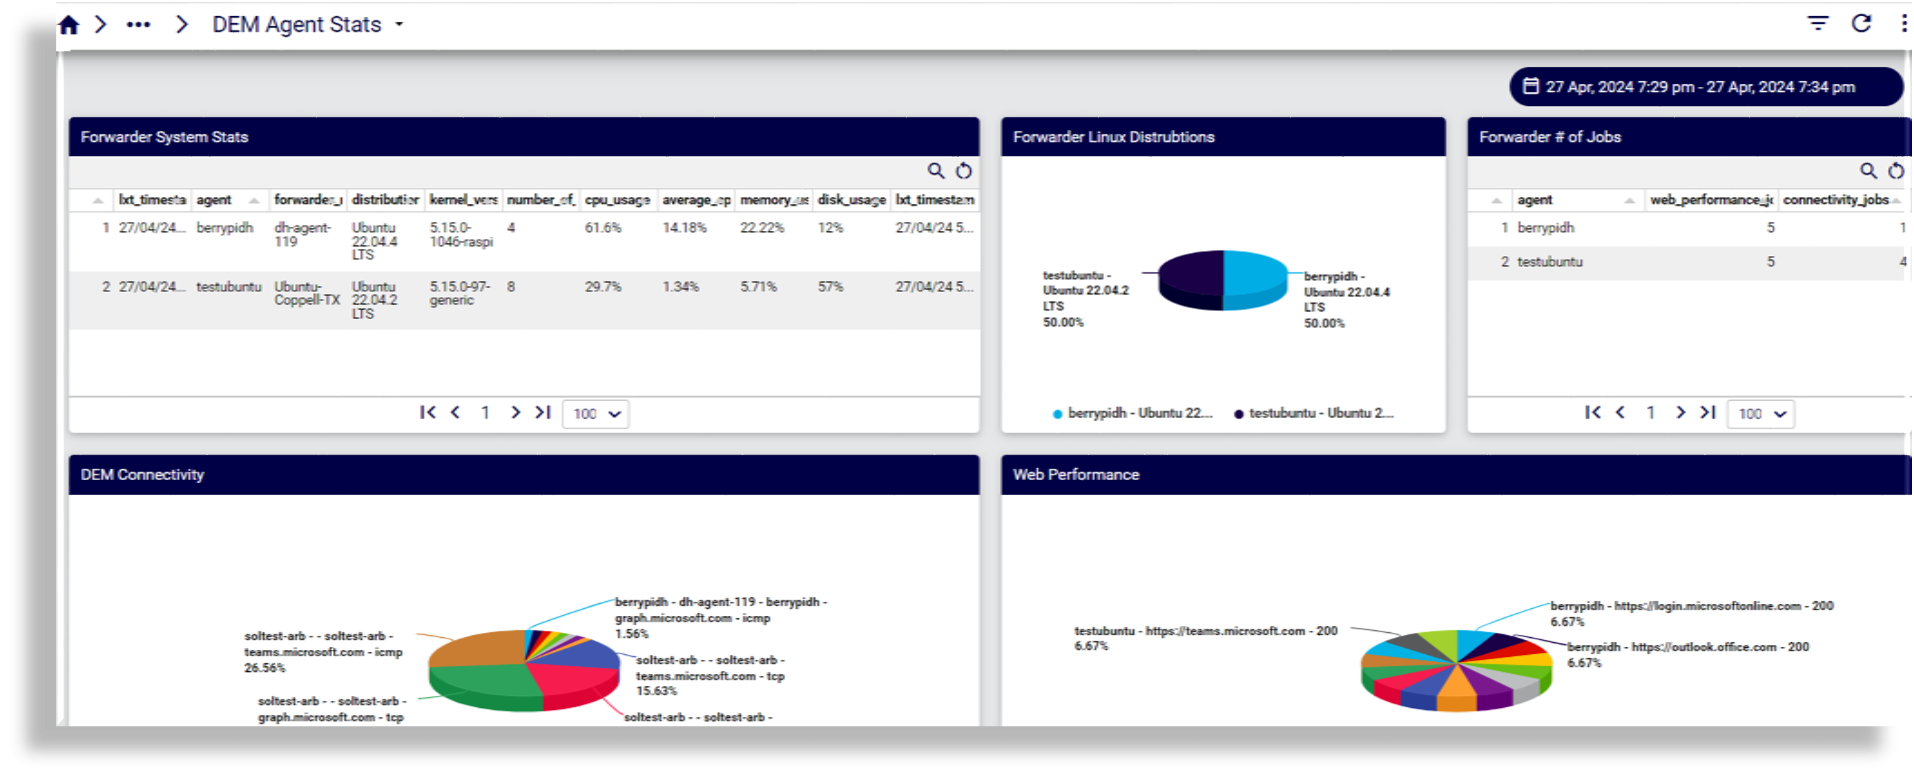
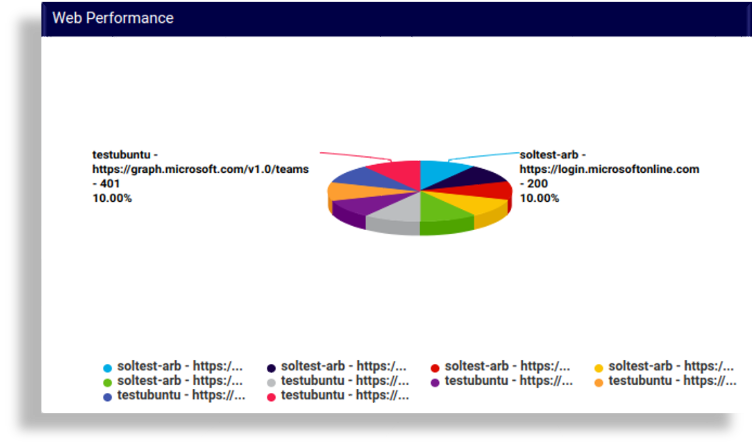
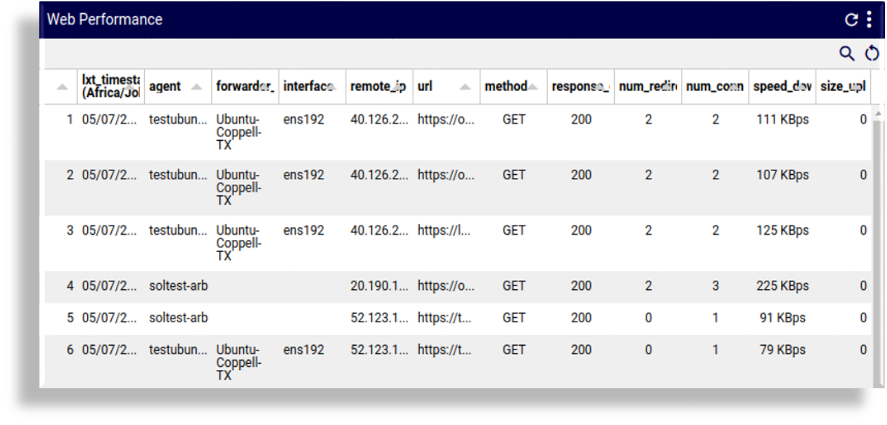
Example Web performance stats: chart and table:
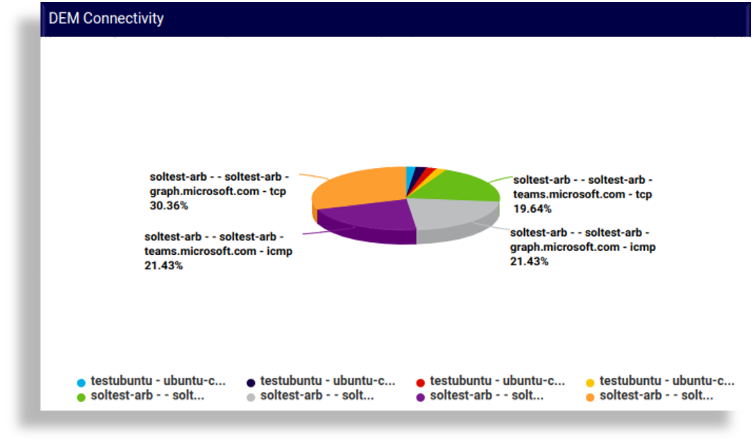
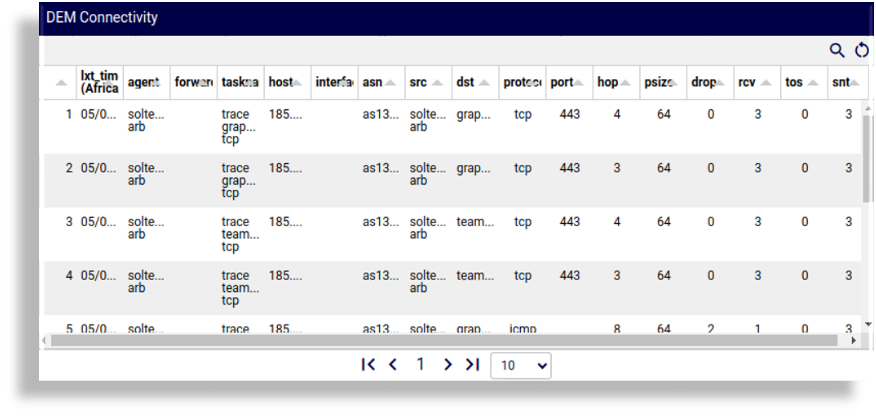
Example Connectivity performance stats: chart and table:
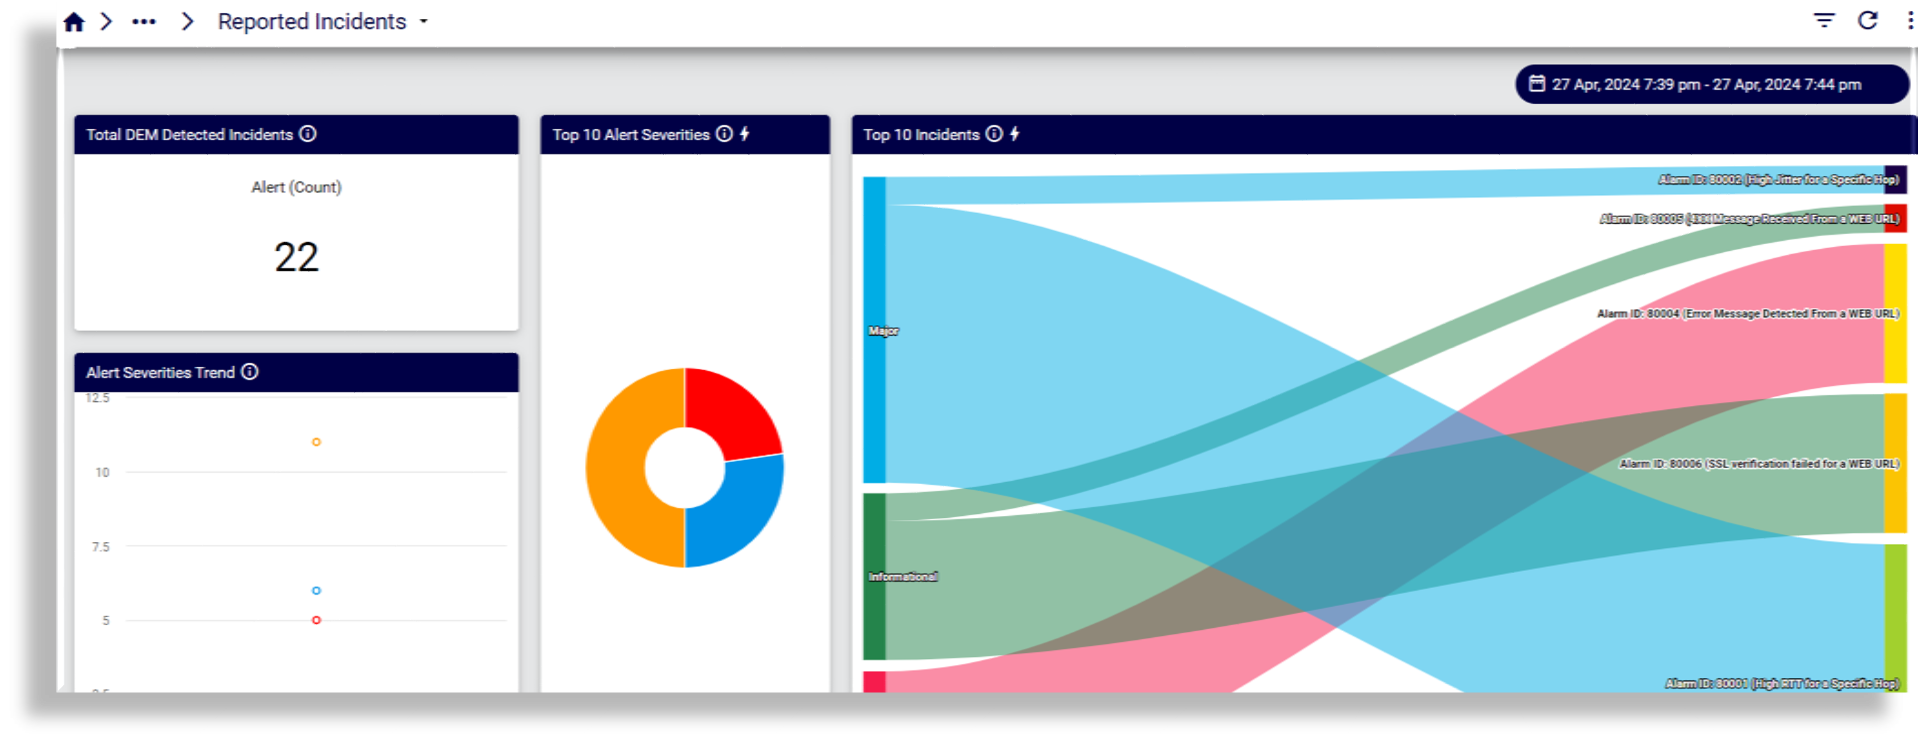
Reported Incidents
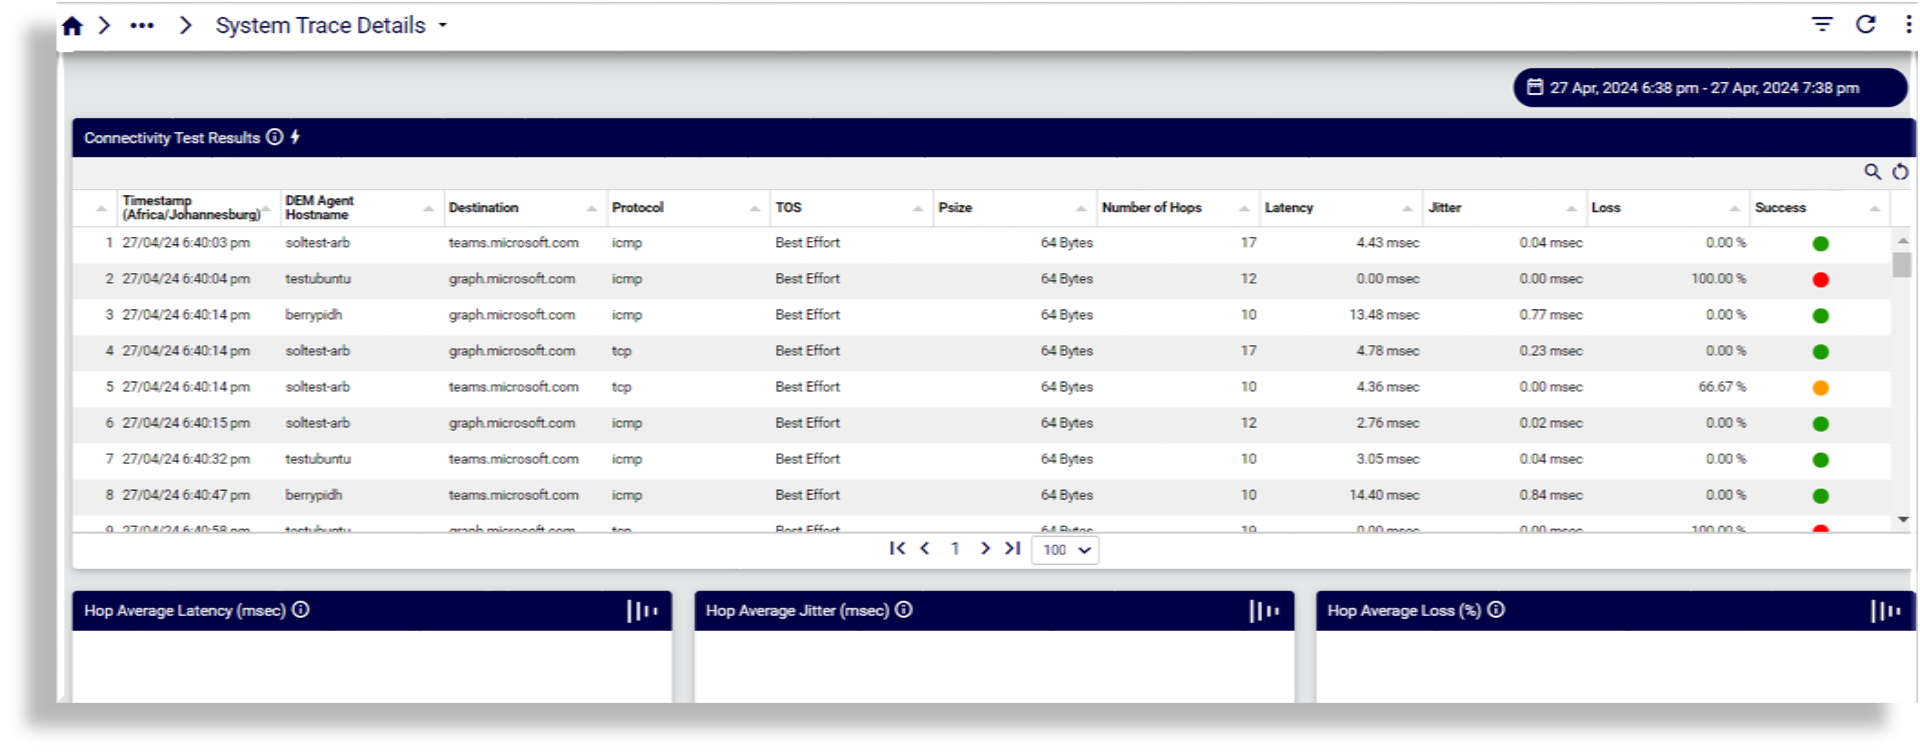
System Trace Details
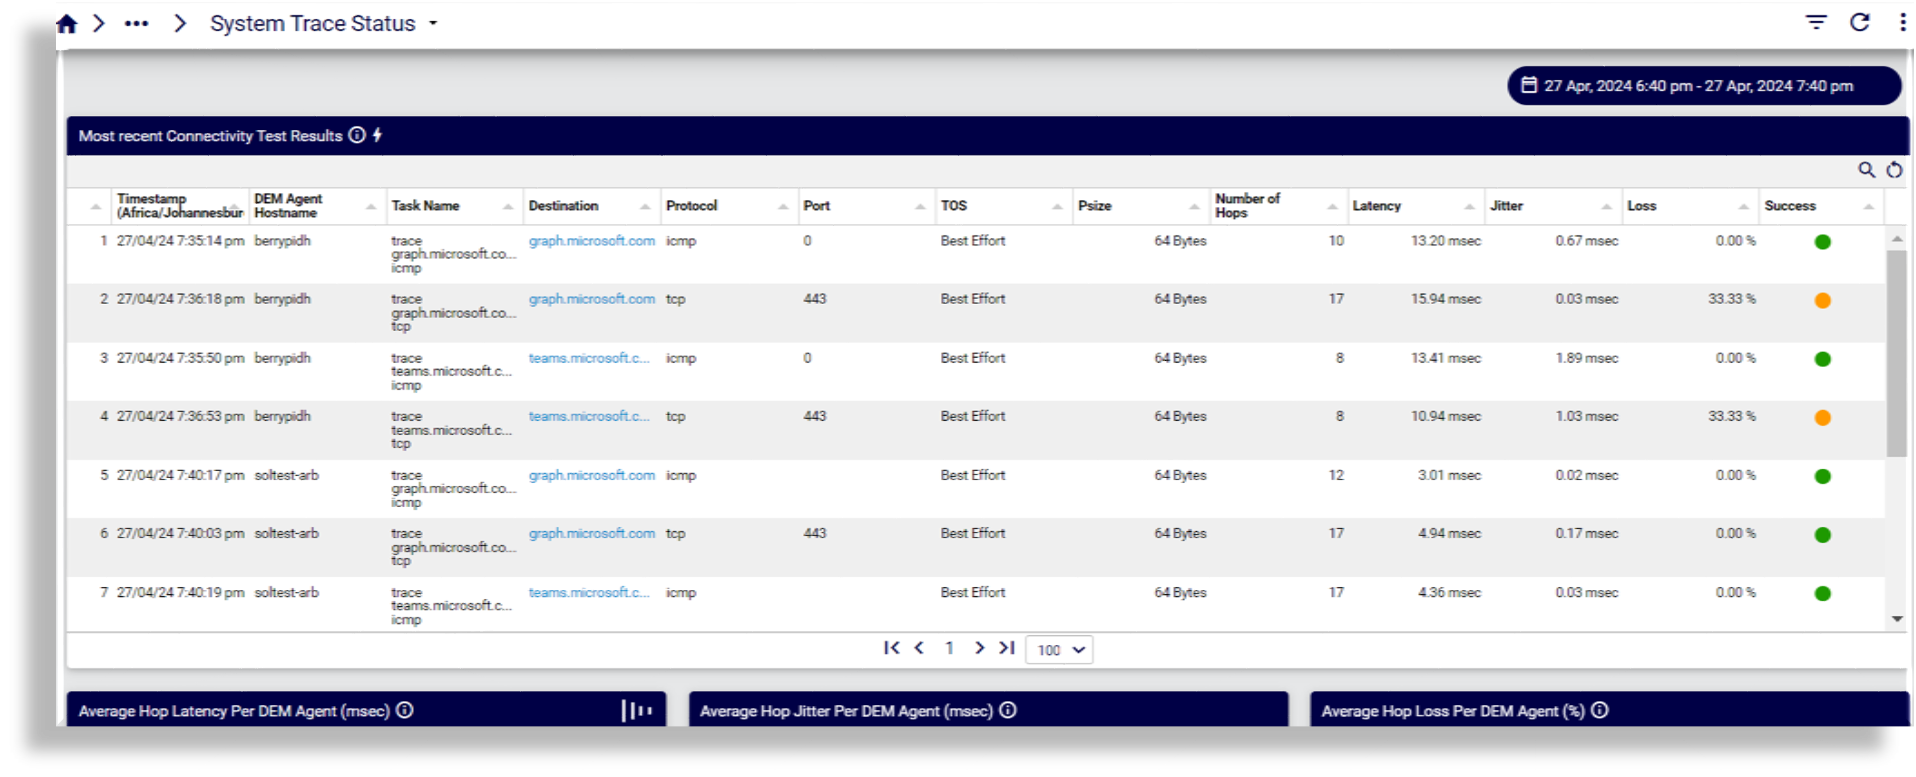
System Trace Status
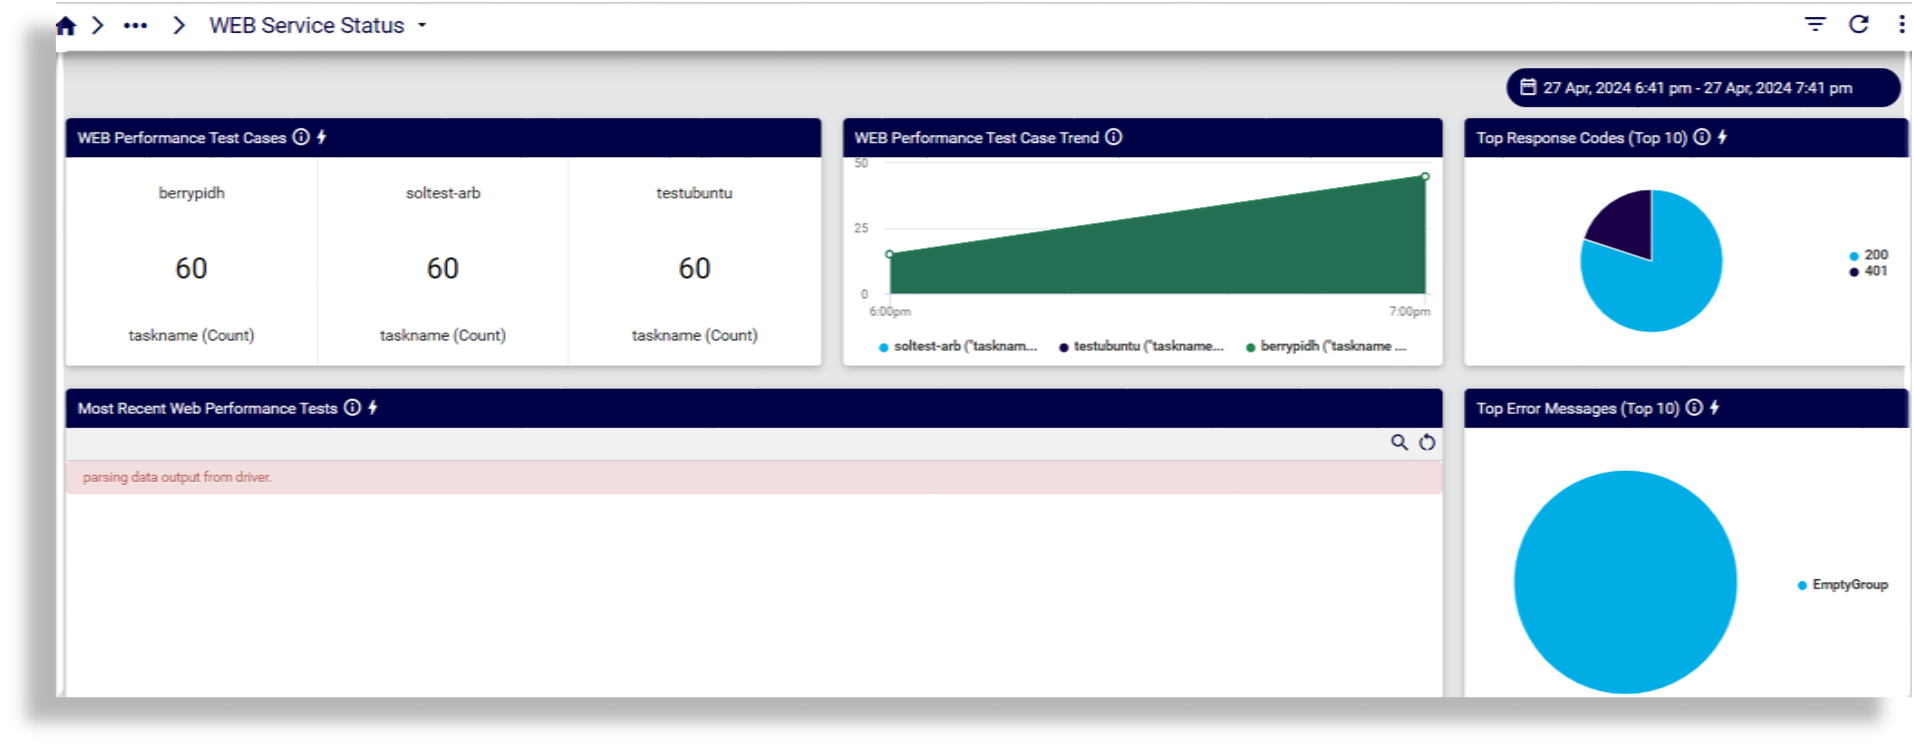
WEB Service Status
Usage & Adoption#
Microsoft#
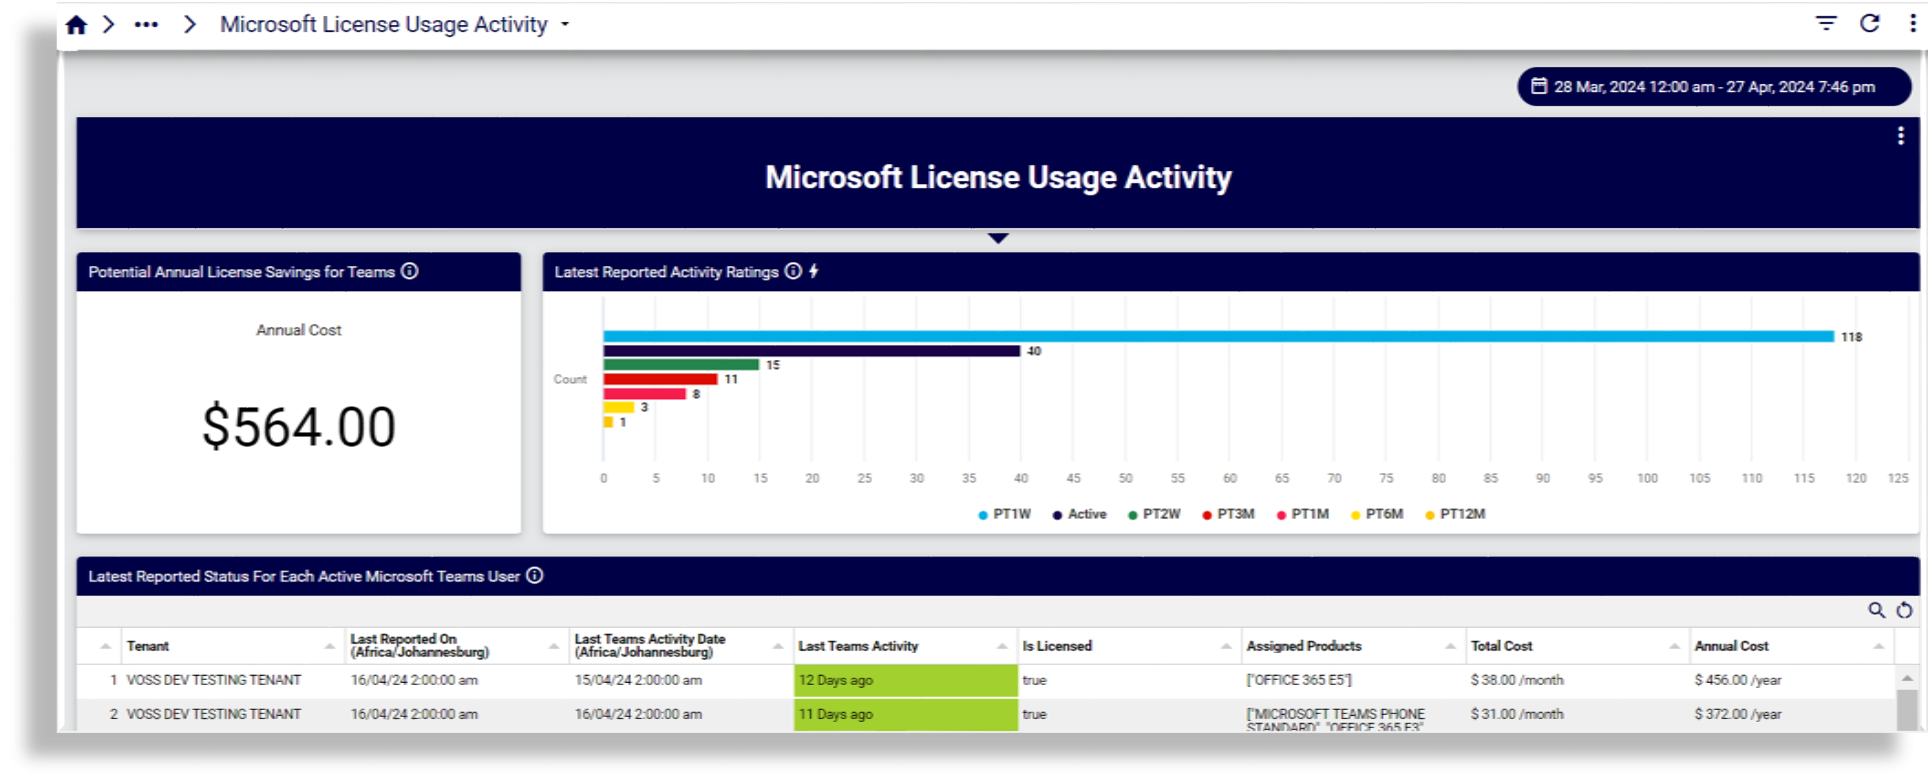
Microsoft License Usage Activity
Reports on annual cost, user activity and inactivity by time periods (months, weeks), as well as tenant and user breakdown by last teams activity and cost.
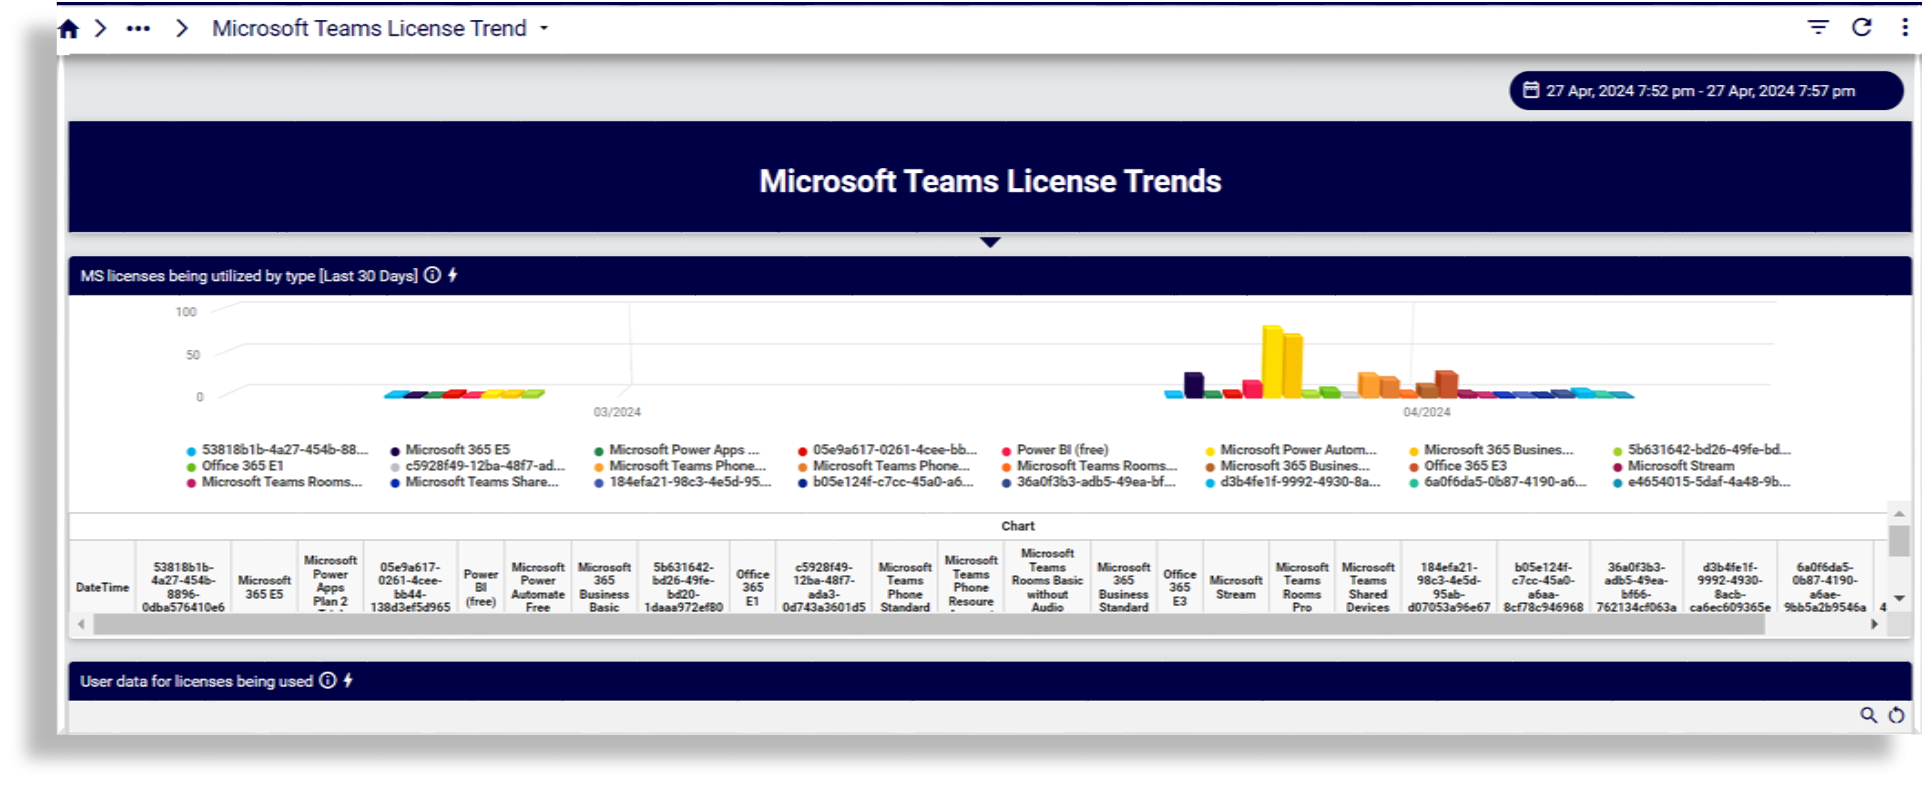
Microsoft Teams License Trend
Reports on license usage by type and number of licenses used.
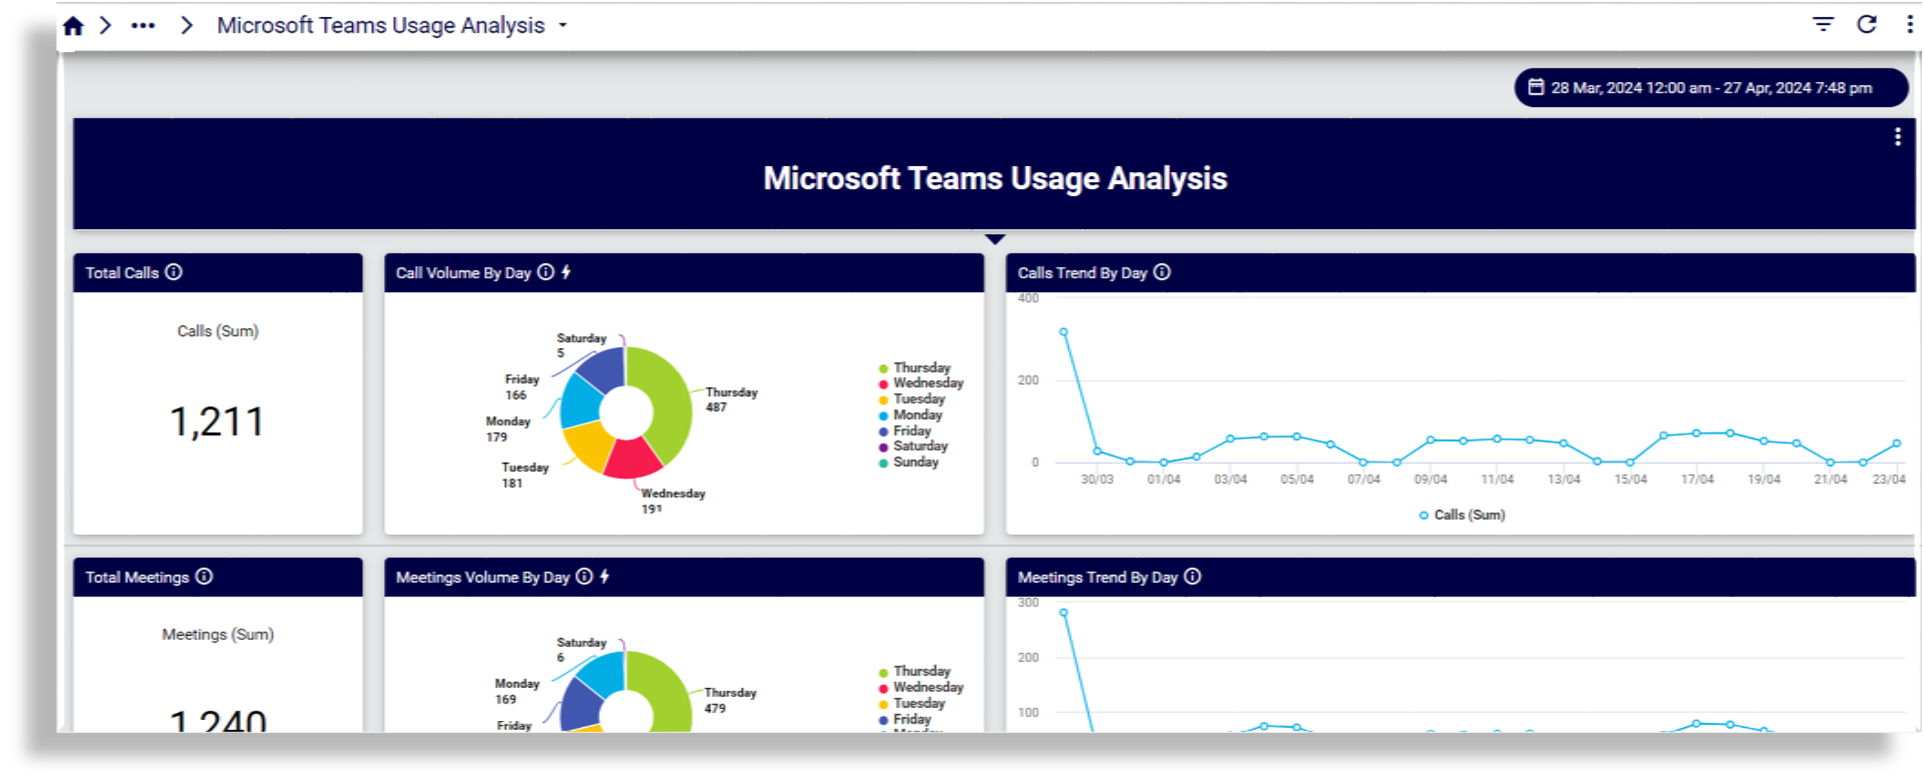
Microsoft Teams Usage Analysis
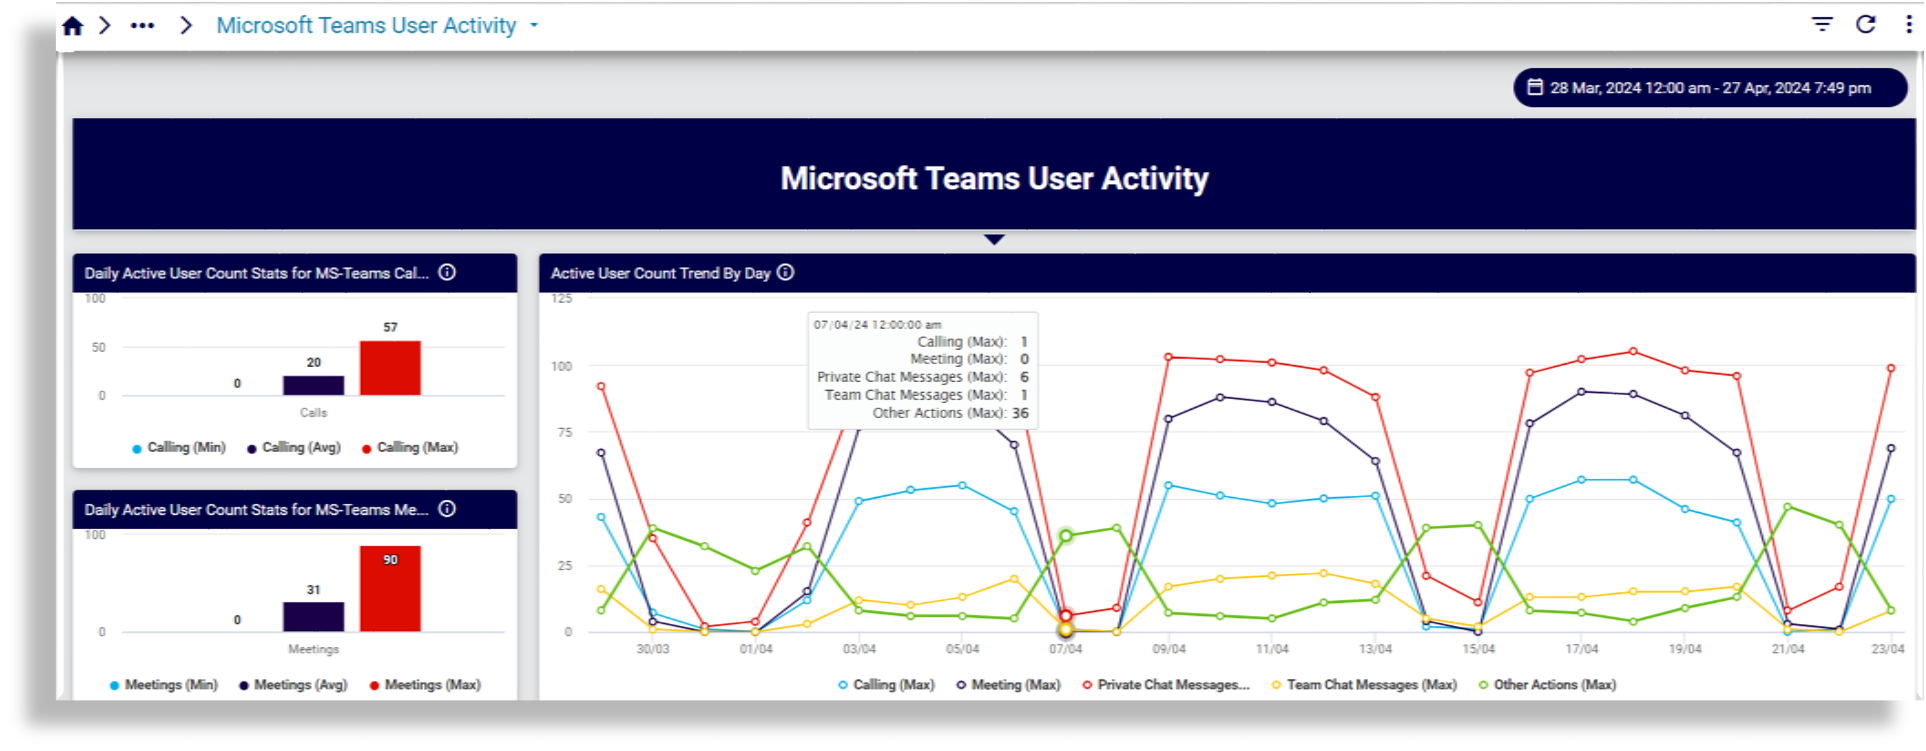
Microsoft Teams User Activity
Reports on active user counts by calling, meetings, chat, busiest days
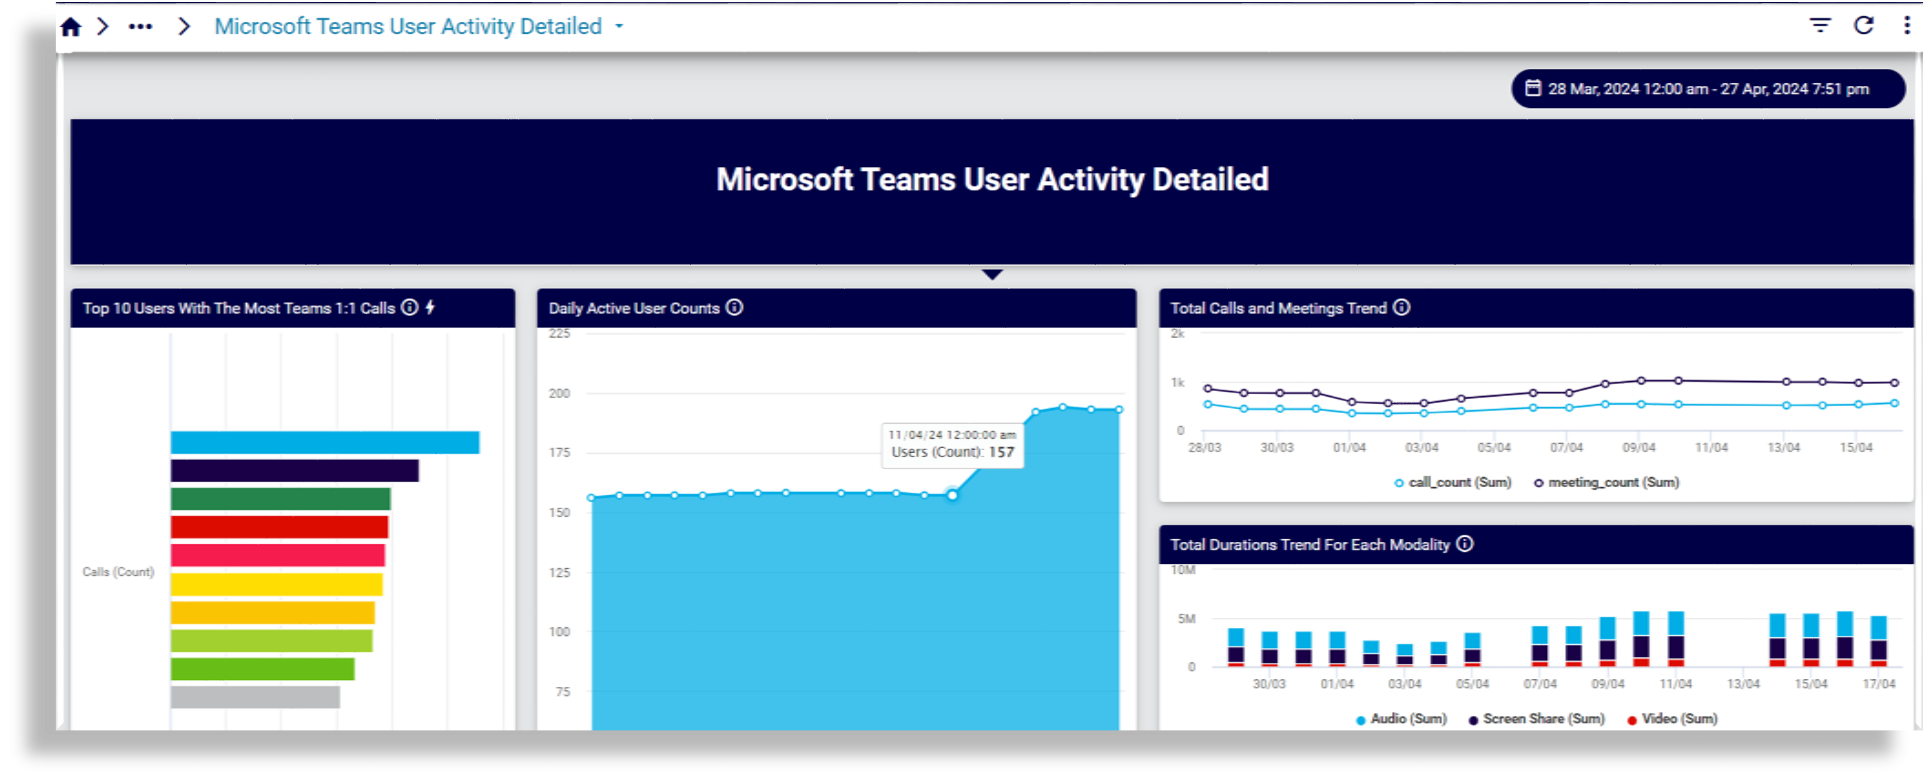
Microsoft Teams User Activity Detailed
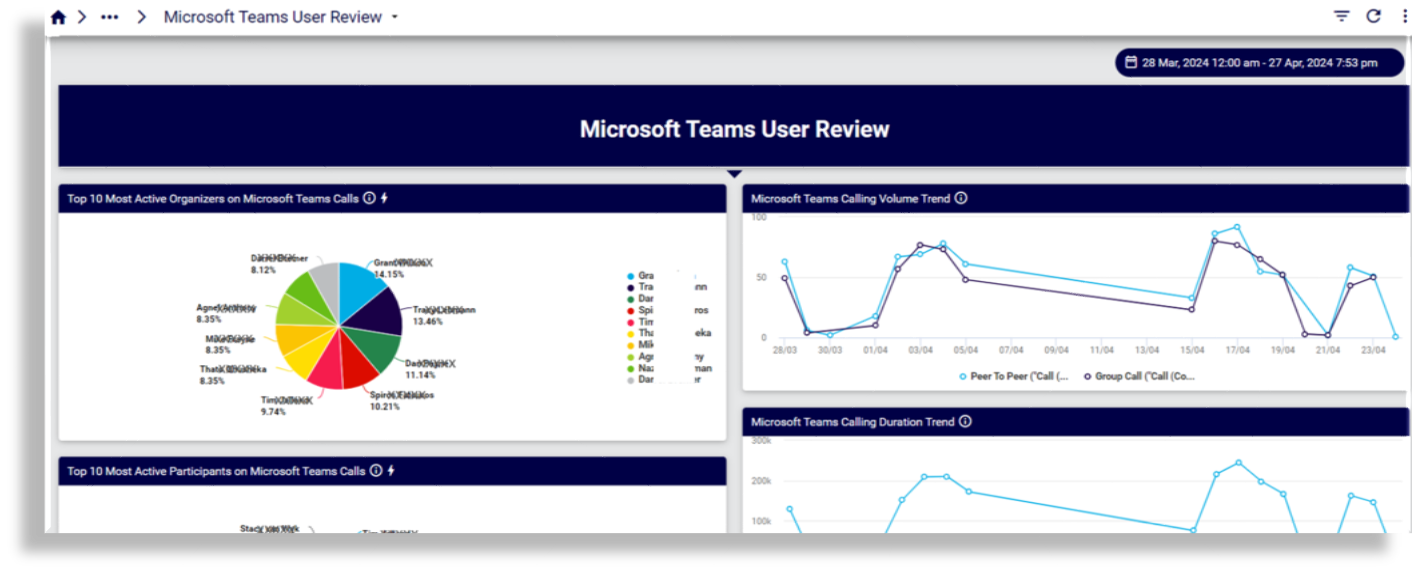
Microsoft Teams User Review
Reports on most active calling organizers, participants
Webex#
Meetings
Meetings Quality
Meetings Quality 1
Meetings Who Joined
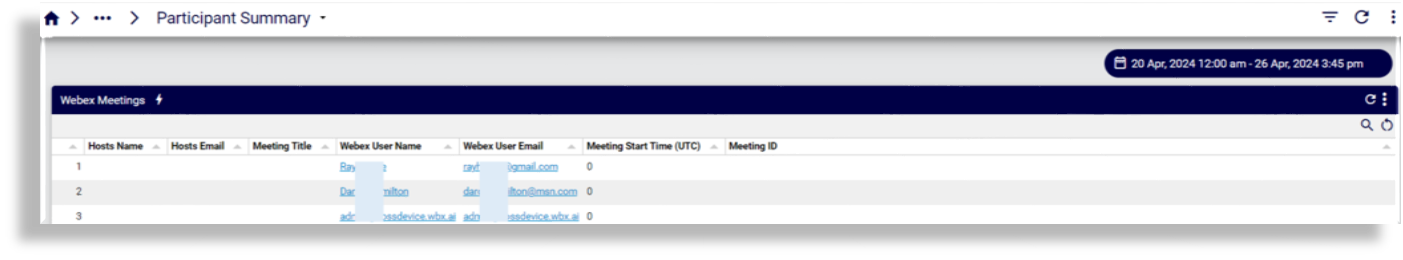
Participant Summary
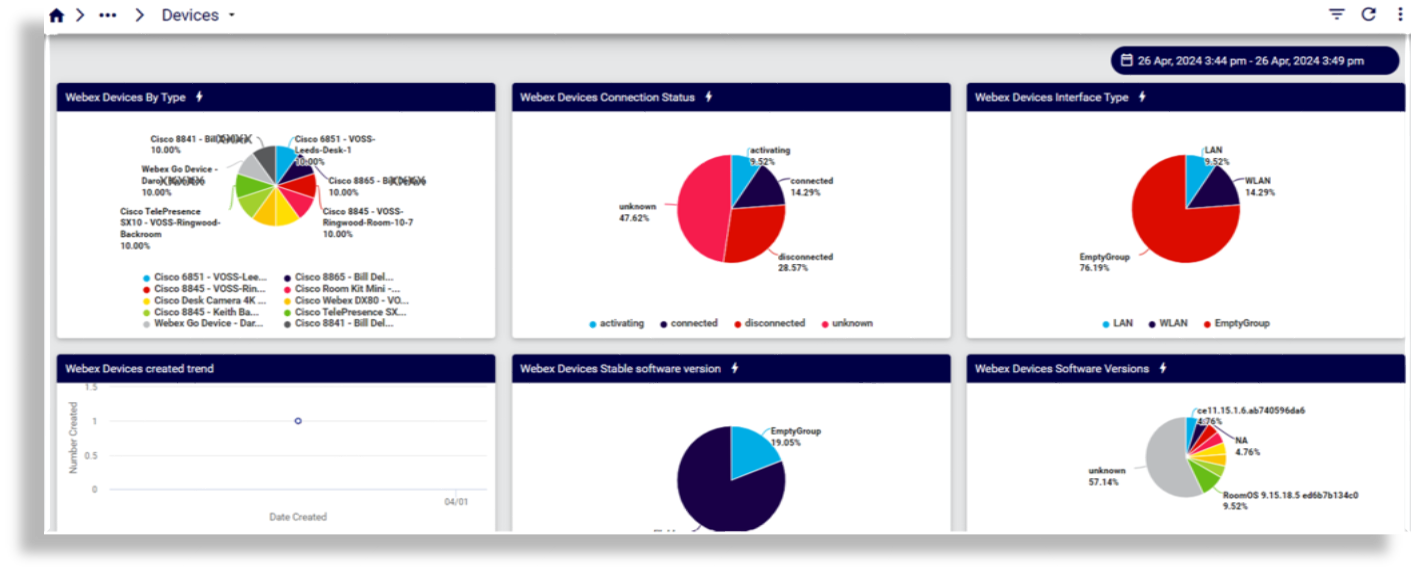
Devices
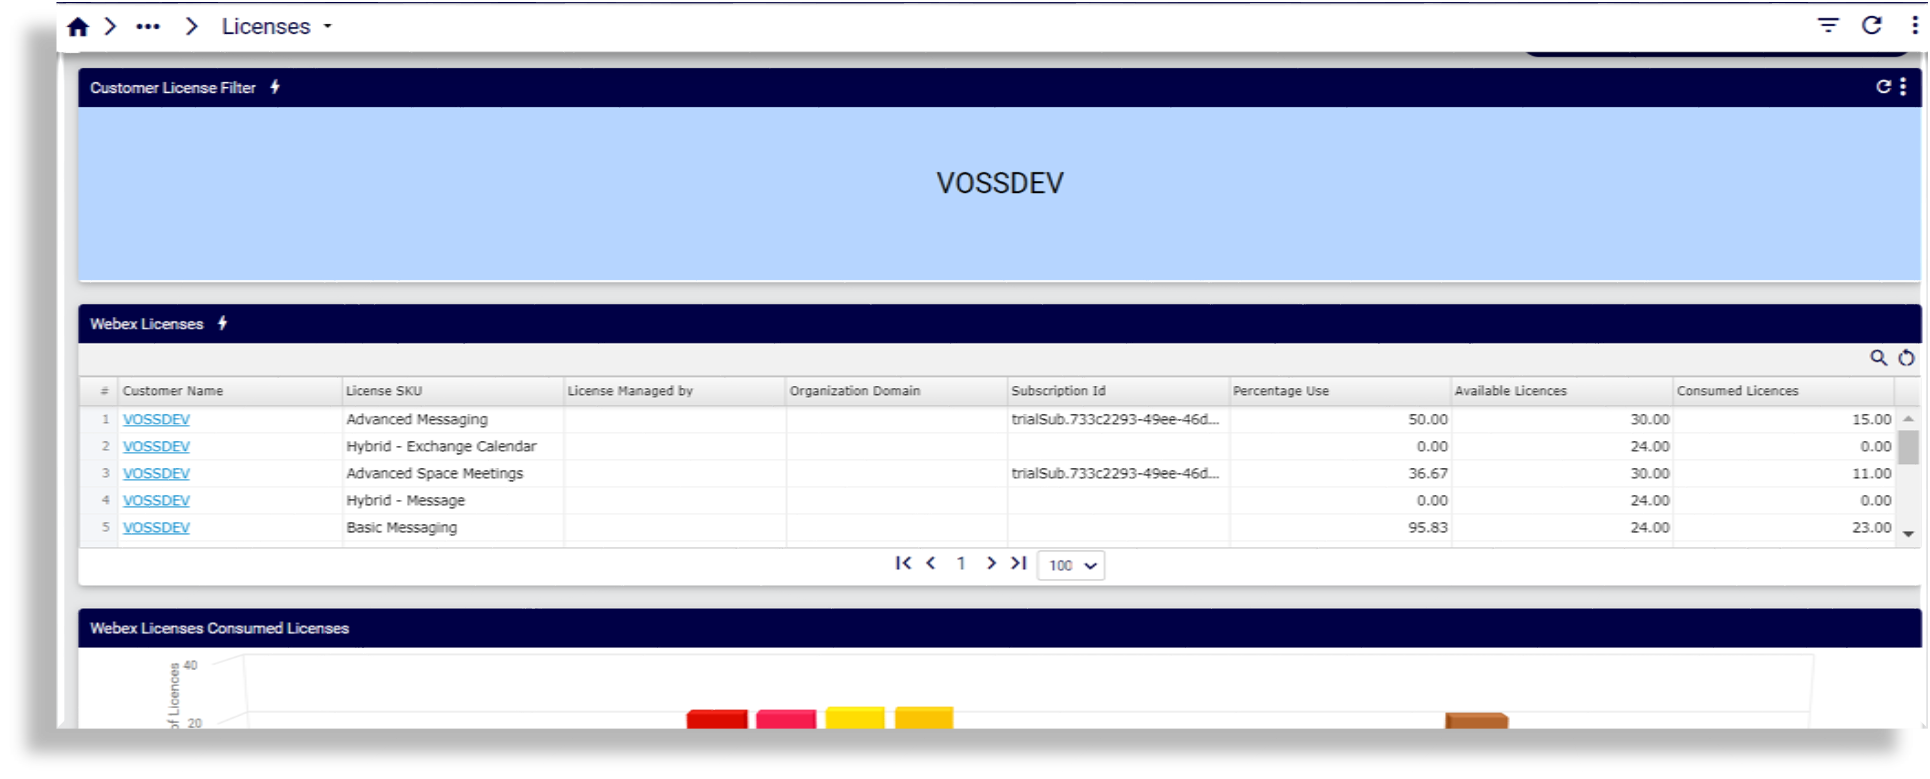
Licenses
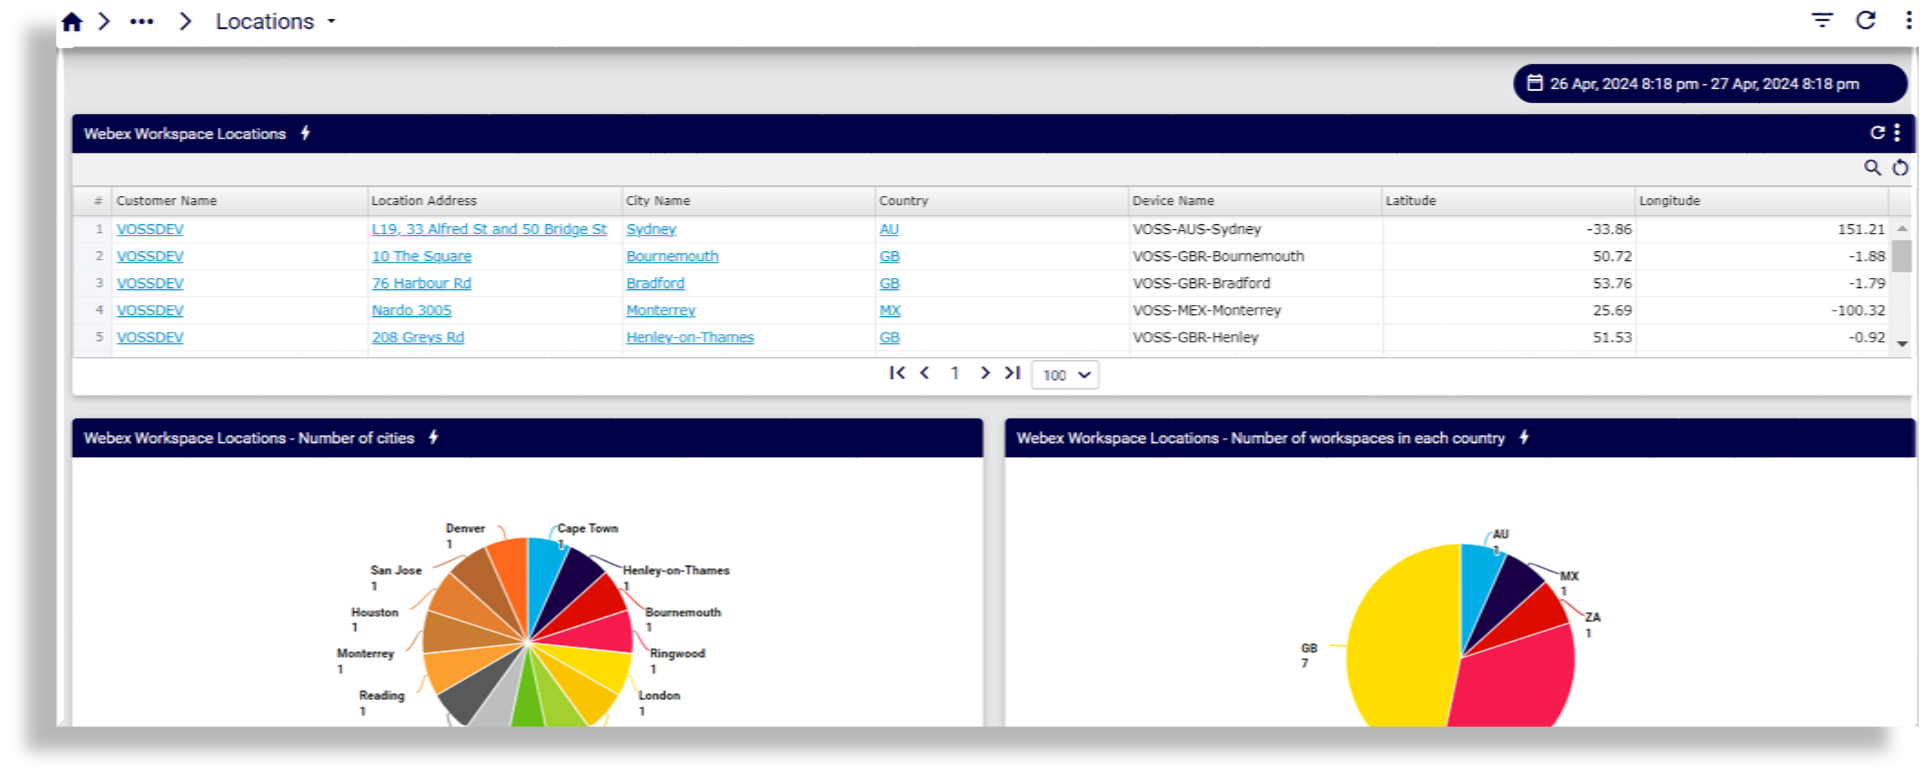
Locations
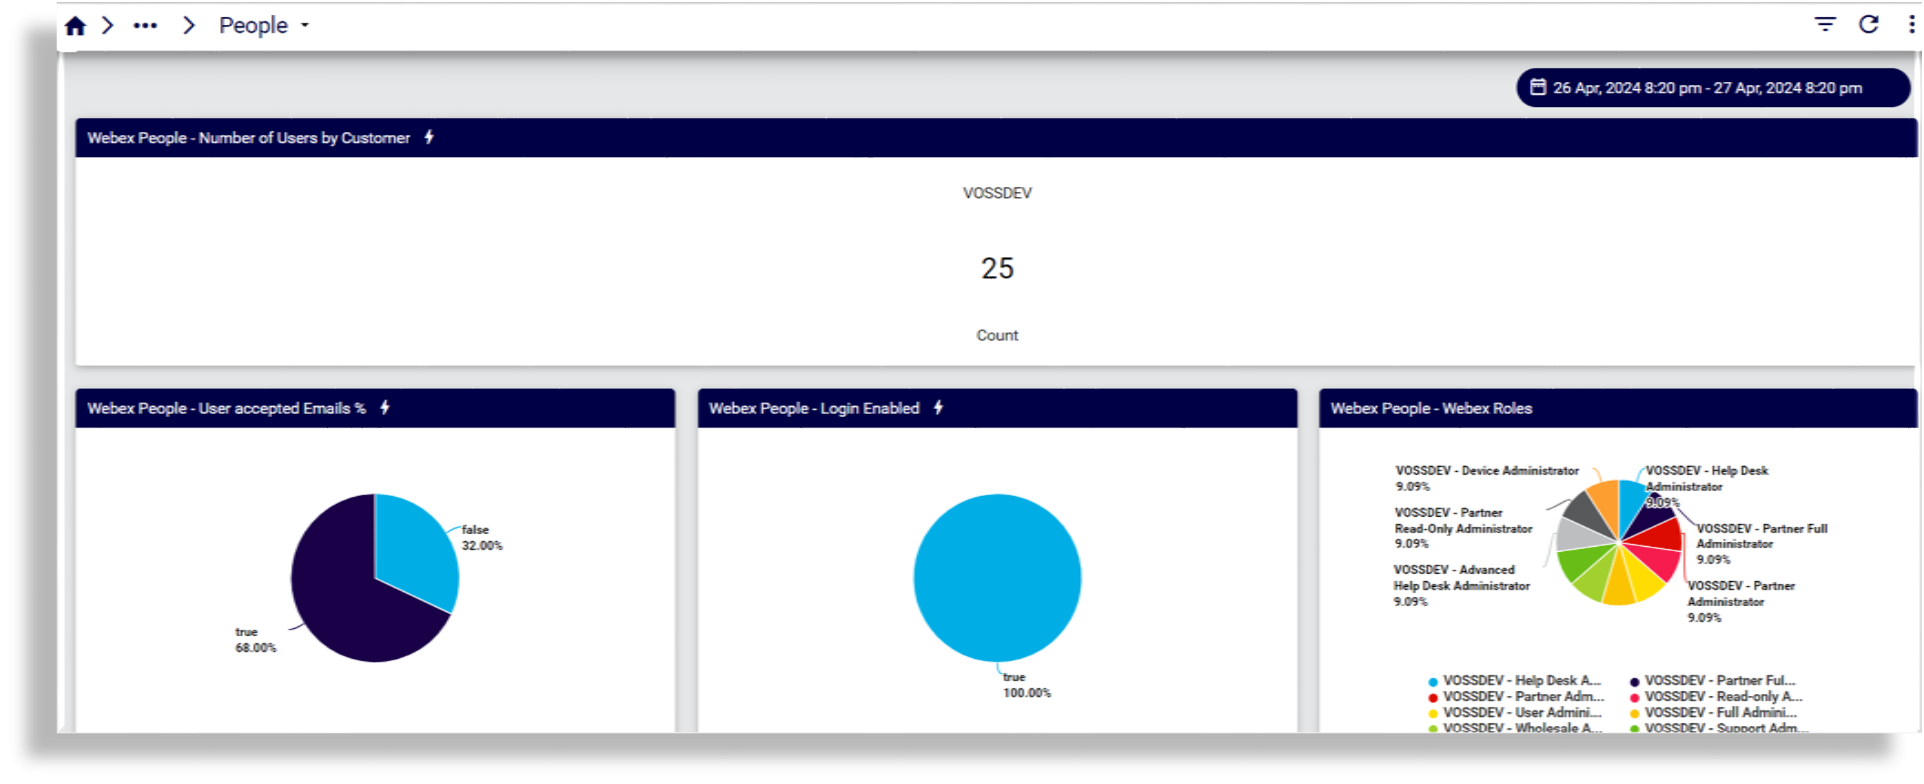
People
Webex Calling
Webex Insights
Webex Security
User & Device Inventory#
Cisco#
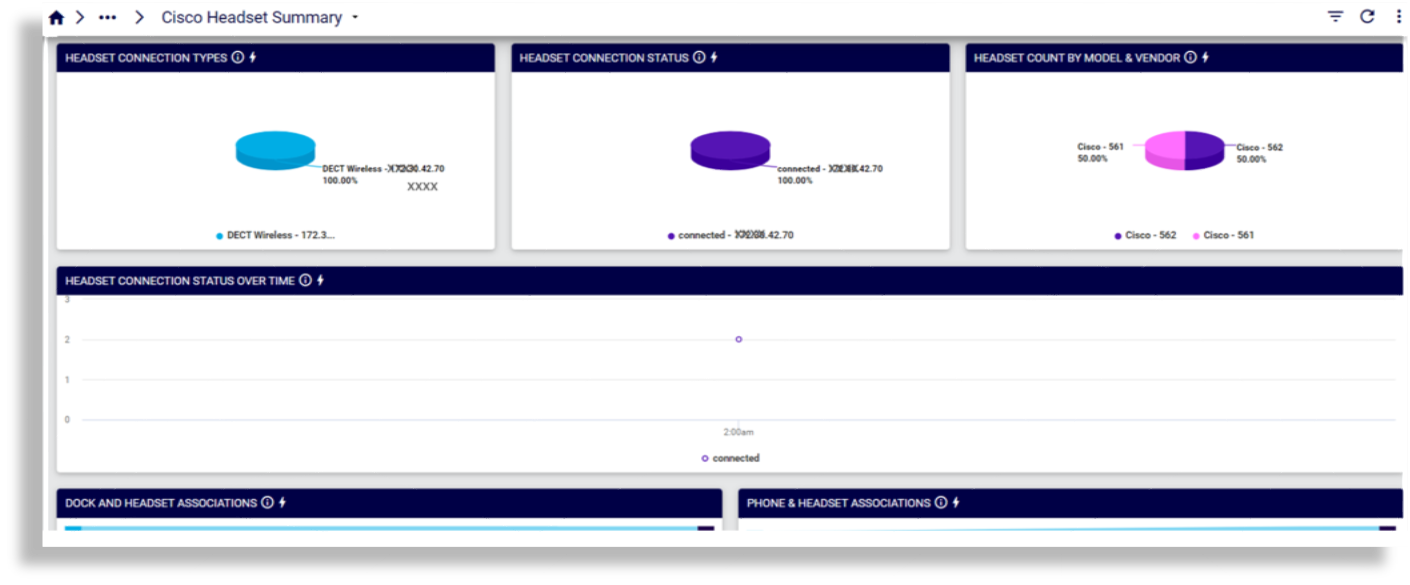
Cisco Headset Summary
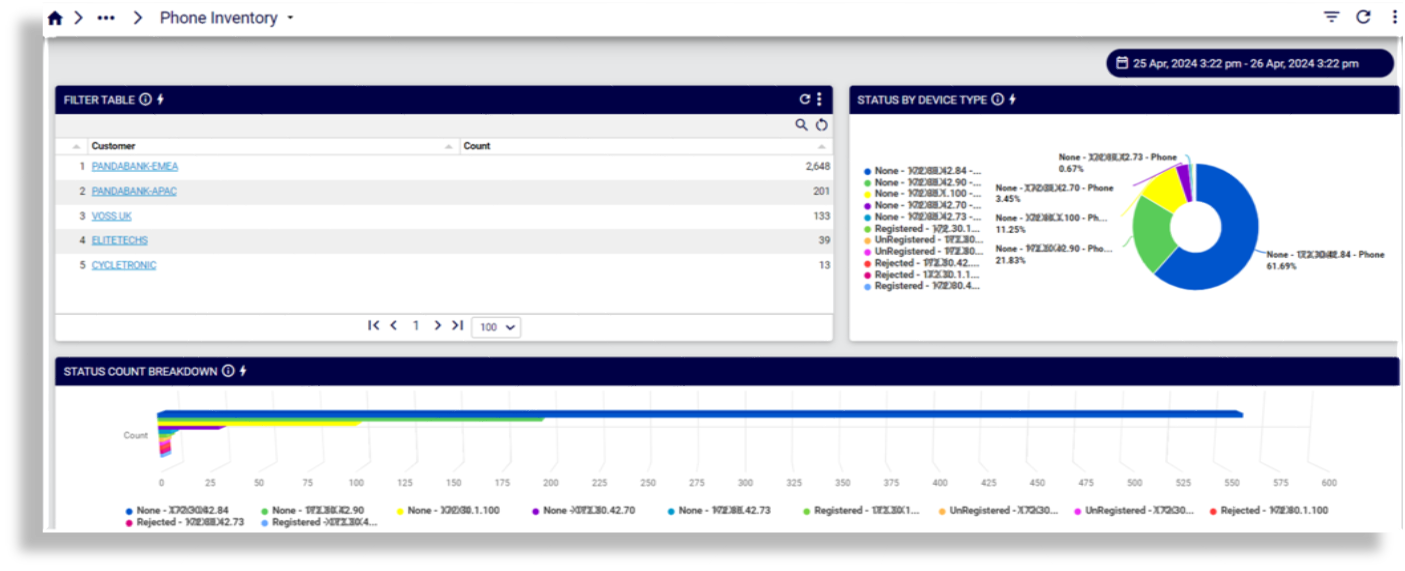
Phone Inventory
Inventory#
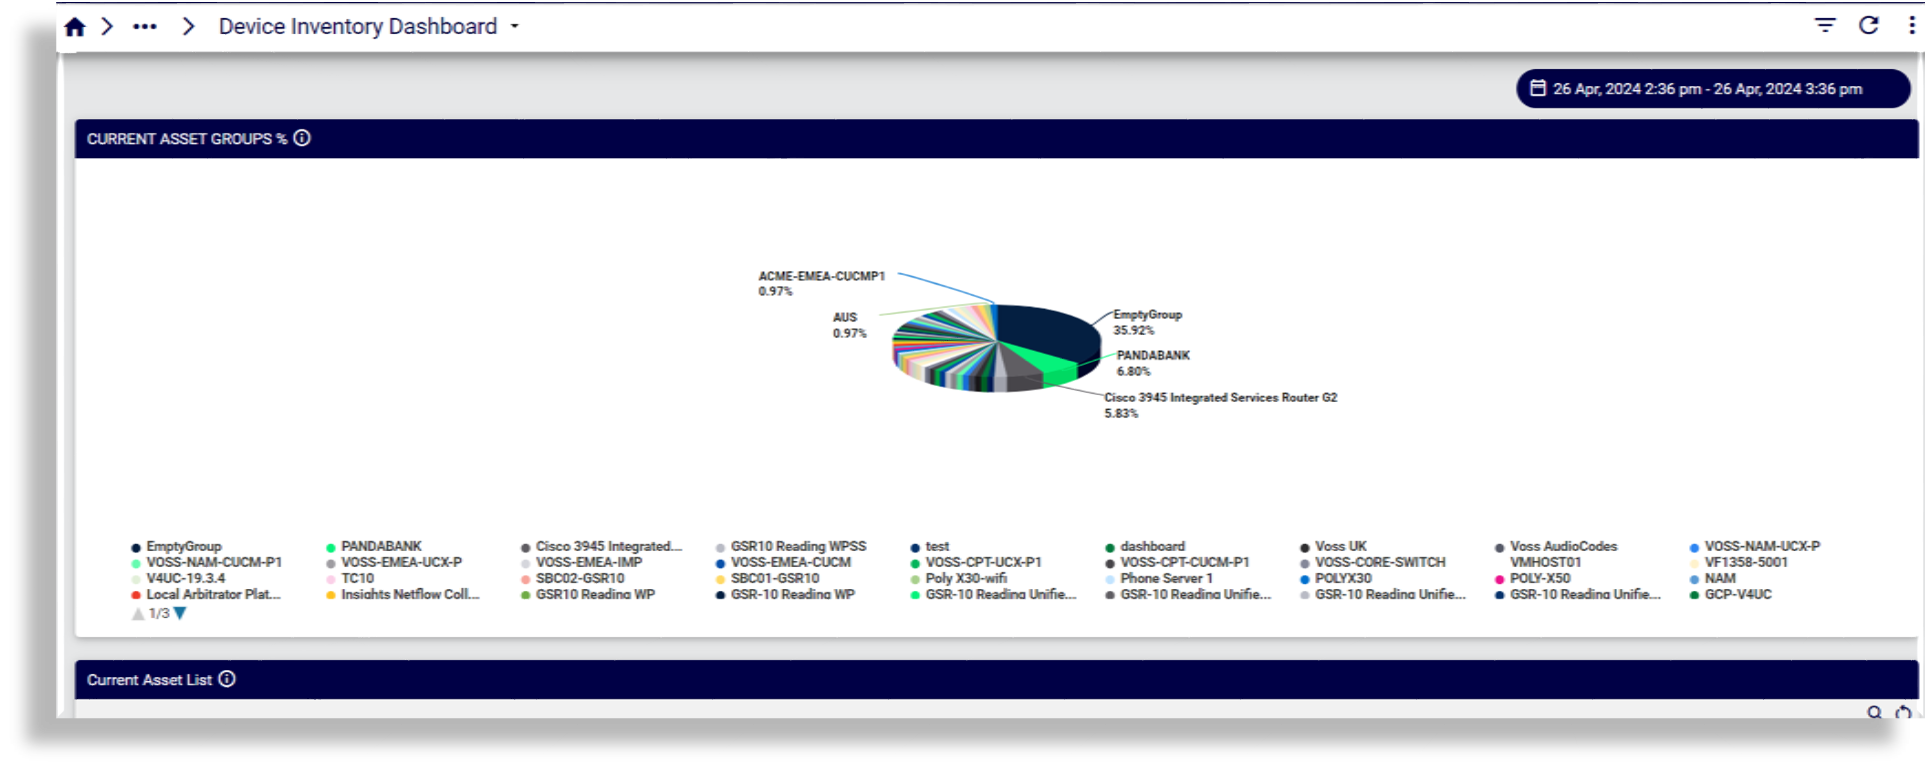
Device Inventory Dashboard
Microsoft#
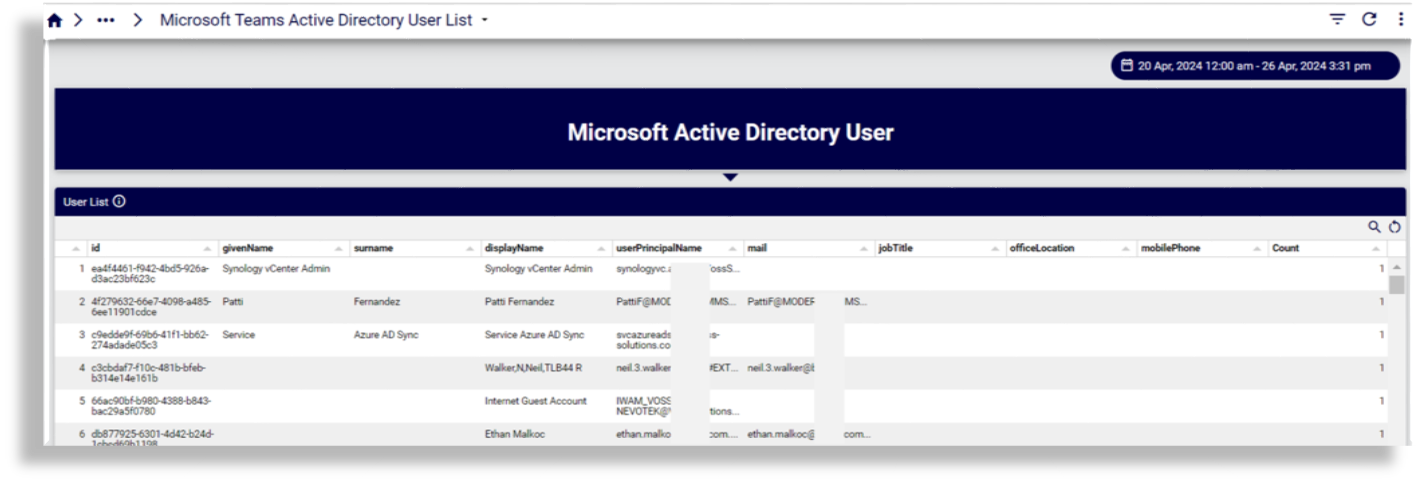
Microsoft Teams Active Directory User List
Reports on user list with user details
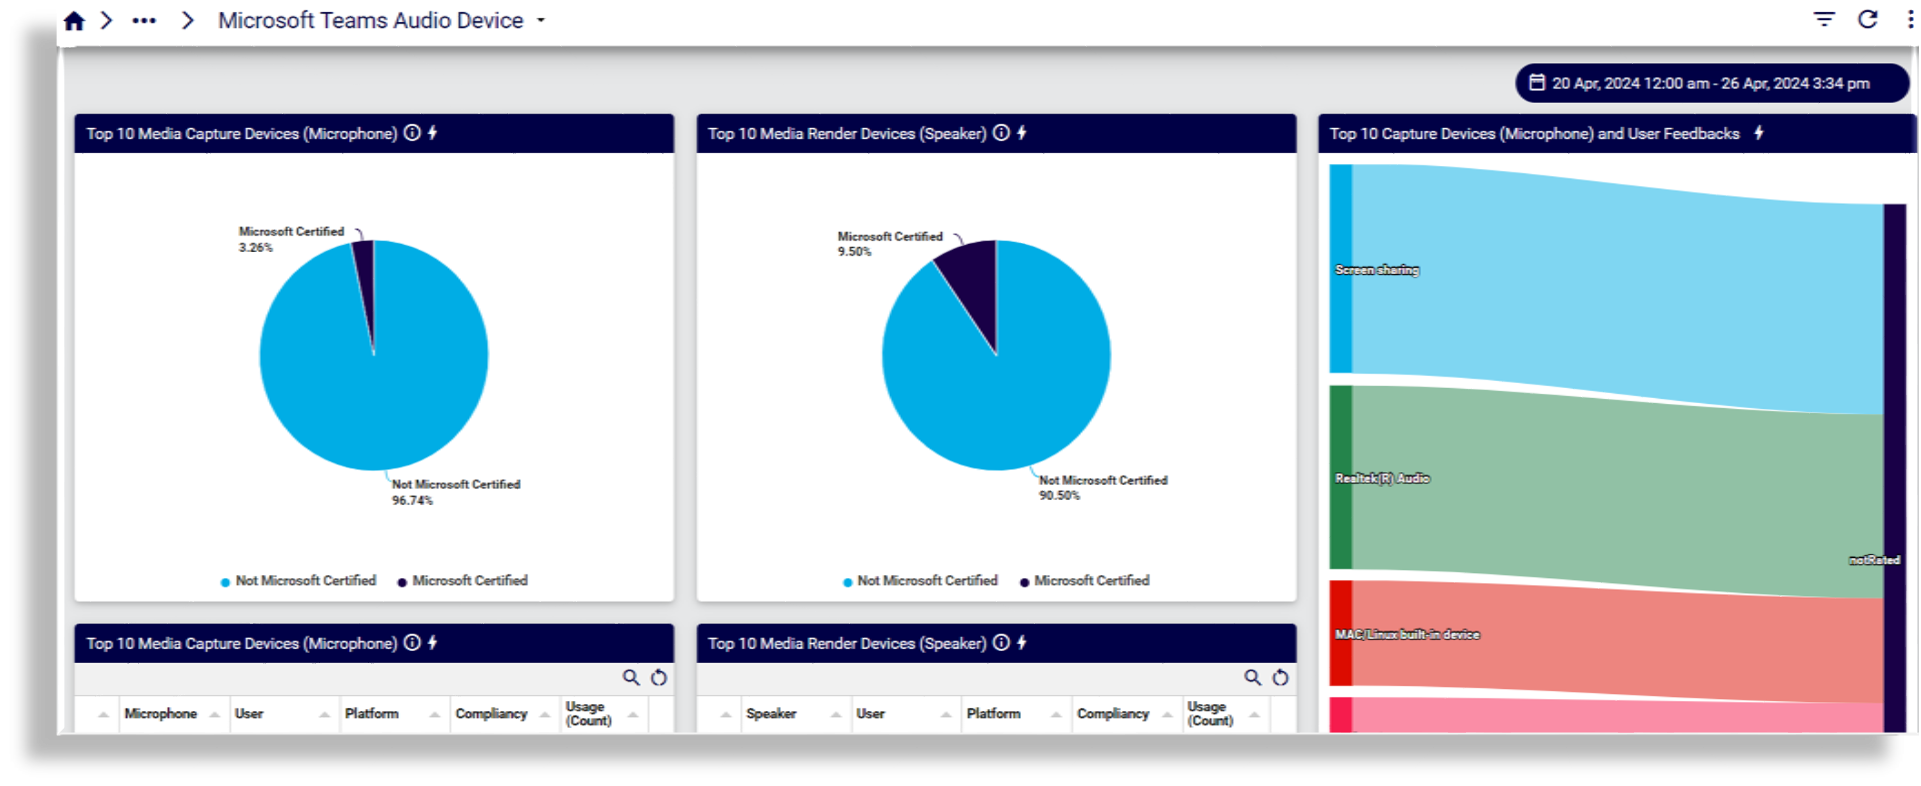
Microsoft Teams Audio Device
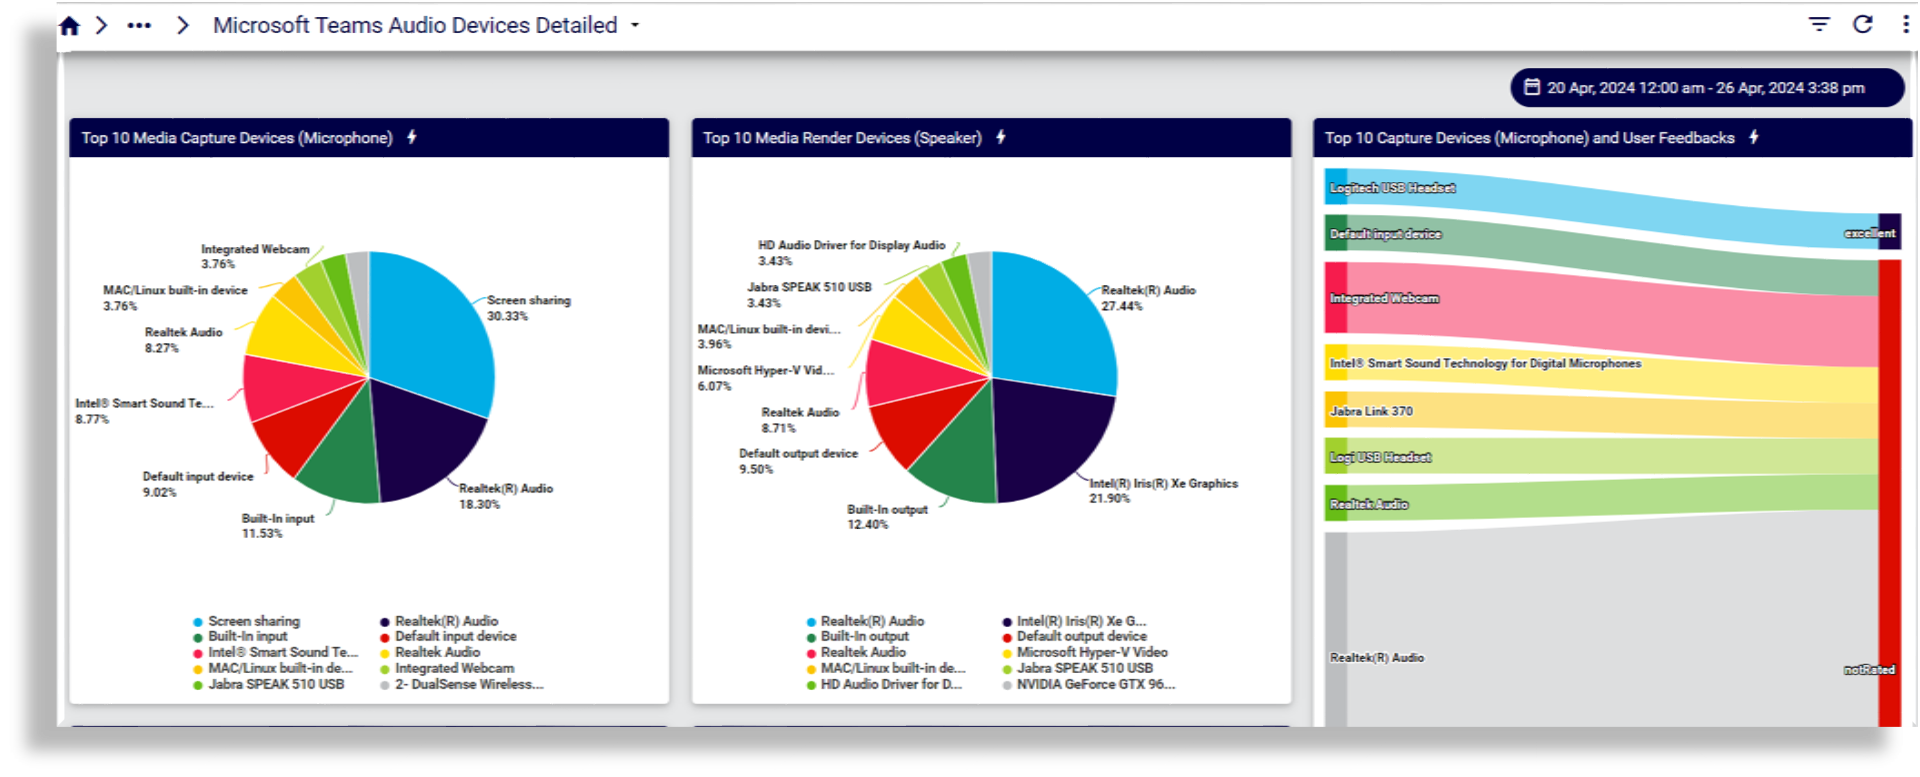
Microsoft Teams Audio Devices Detailed
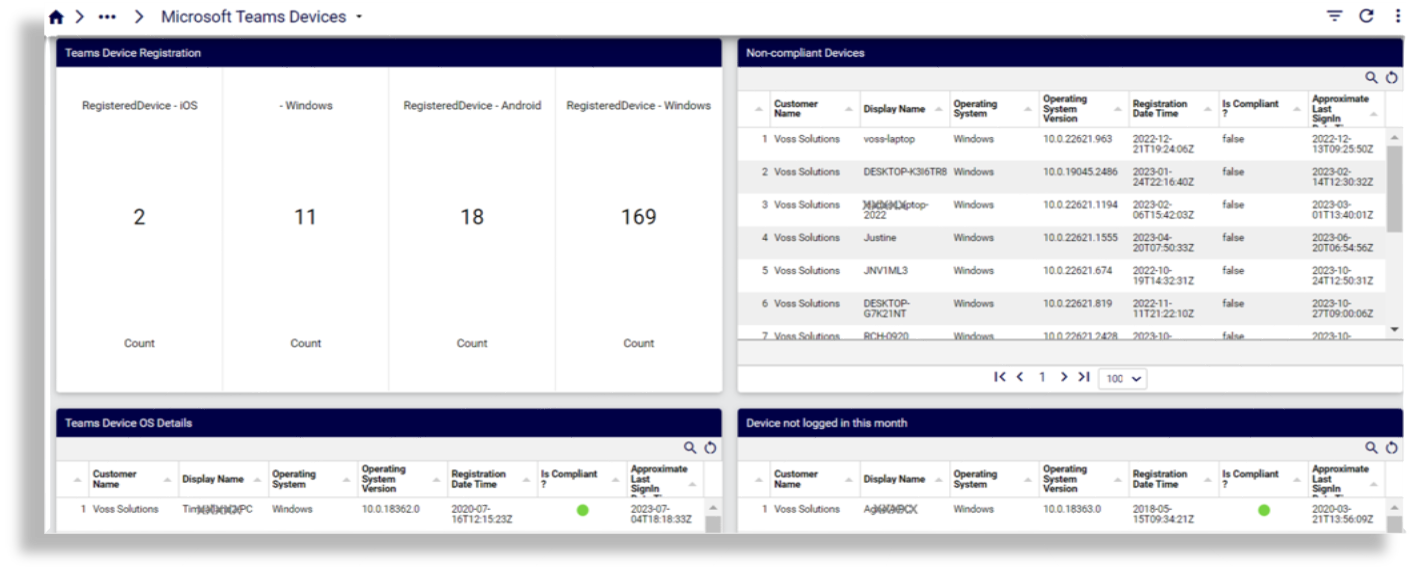
Microsoft Teams Devices
Microsoft Teams Teamwork Devices
Reports on device types, hardware models, buildings and meeting rooms