Working with Dashboard Widgets#
Overview#
Dashboards contain several editable widgets that you can configure in the Widget Editor. You can modify their look and feel, and configure the data presented in each widget.
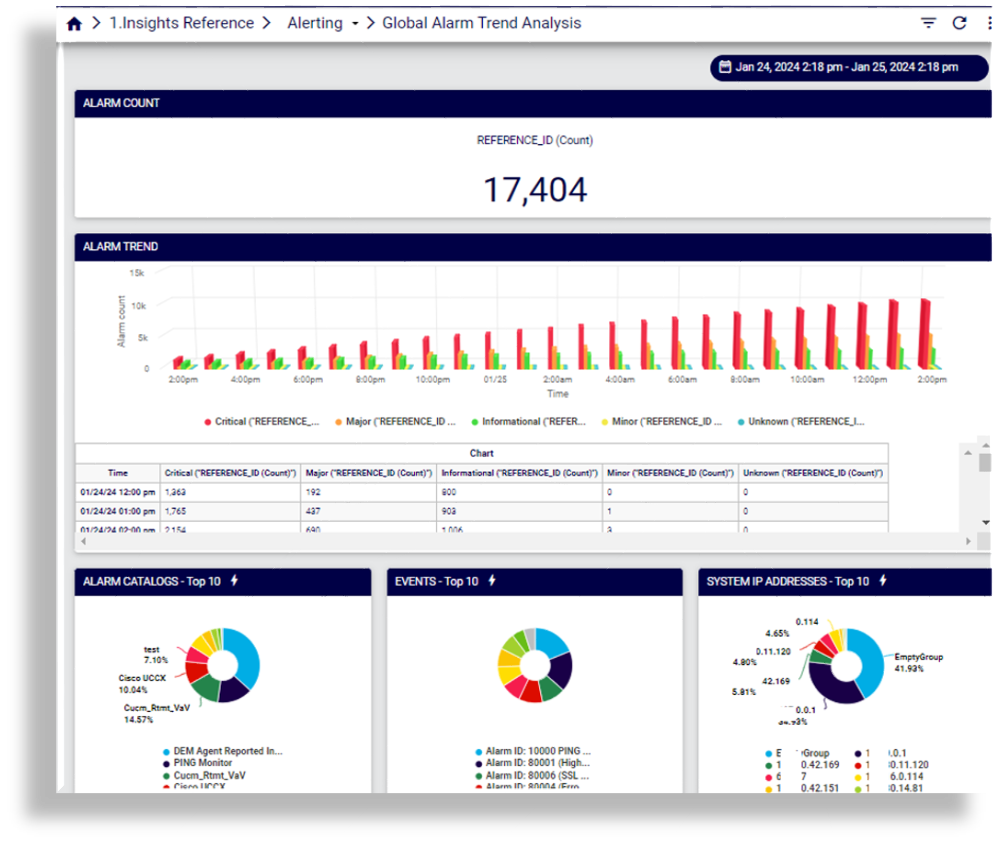
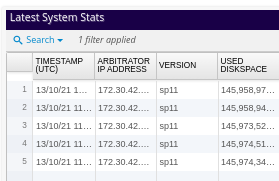
The image shows a dashboard with several widget types:
Note
For details around adding a new widget to a dashboard, or for changing a widget’s position on a dashboard, see Working with Dashboards.
A widget is set up to define the data to display on a dashboard. The data may come from various sources, including, for example, data from CDRs imported to a directory, data collected by probes, or data synced from Automate. Regardless of the source, the system processes the data and populates the appropriate database tables.
A CRON job, which runs every minute, processes the files to populate the tables on the Arbitrator. You can then set up a widget on the relevant dashboard and select the resource, for example, Oracle CDR data, and the required search definitions (data to display), to retrieve and display this data on the dashboard.
Note
When working with a dashboard, you may want to manually refresh the data in a widget (from the database). In this case, you can
click the Refresh icon ![]() at the top right of the widget.
at the top right of the widget.
For details around choosing and configuring the resource and definitions for the widget, see Resource Tab
For details around adding customer CDRs to a directory, see:
Edit a Widget#
You can access widget editing options via the vertical ellipsis icon ![]() at the top right of a widget. See
Widget Options Menu.
at the top right of a widget. See
Widget Options Menu.
To edit an existing widget:
Open the relevant dashboard.
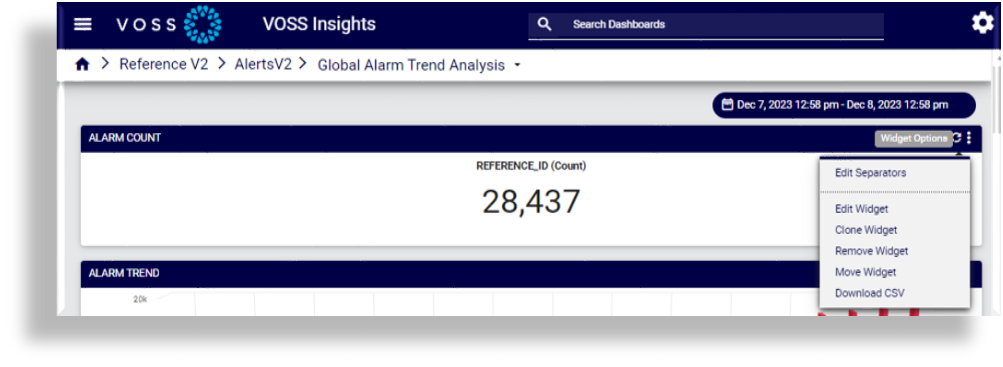
Click the ellipsis icon (Widget Options) at the top right of the relevant widget on the dashboard to display the Widget Options Menu.
Choose the relevant option for updating the widget, for example, you can edit, clone, move, or remove the widget, or download data.
Note
The widget editing options that display depend on the type of widget you’re working with.
Make your changes, then save.
Related Topics
Widget Options Menu#
Overview#
Click the vertical ellipsis icon ![]() at the top right of a widget to access the Widget Options menu.
at the top right of a widget to access the Widget Options menu.
Editing options in the Widget Options menu depend on the widget type and user permissions. For example, Save Chart is only available if the widget type is chart.
The table describes the possible widget editing options:
Option |
Description |
|---|---|
Save Chart |
(Only available if the Widget is a Chart). Saves any widget to your desktop. This file can then be imported into documents for custom reporting. |
Edit Separators |
Opens a separate page where you can select one or more separators that you want to use on your widget, i.e. Left, Right, Top, Bottom or All. |
Edit Widget |
Opens the widget editor, where you can edit the data and the analysis of the data that is represented on the widget. See Widget Editor for details. |
Clone Widget |
Creates a copy of the widget, which you can then modify to meet the specific data analysis needed. This is much quicker than creating a brand new widget/dashboard. |
Remove Widget |
Deletes the widget from the dashboard. |
Move Widget |
Launches a tree of all the folders and dashboards in the system. Simply choose the folder and click on the dashboard destination you want. |
Download CSV |
Downloads (formatted) underlying data (chart or table) to |
Download CSV - All data |
Choosing “All data” downloads all table data (without formatting) in
that widget (regardless of the time set in the time-bar) to a
|
Download Excel Workbook |
(Only available if the Widget is a Table.) Downloads (formatted) table data to an Excel file that you can save to your local computer. |
Download Excel Workbook - All data |
(Only available if the Widget is a Table.) Downloads all table data to an Excel file that you can save to your local computer. Global filters are considered. |
Downloading Files (CSV or Excel)#
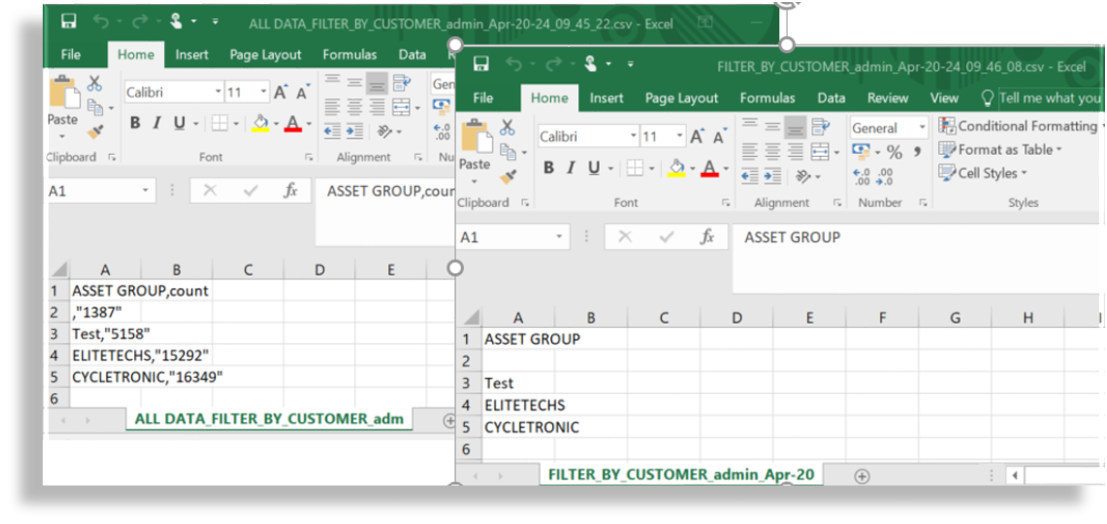
From the Widget Options menu you can download widget data in either CSV or Excel format files - standard download (formatted data), or all data (which includes underlying data in the widget).
The image shows a file download with formatted vs unformatted data:
Filter Data in Downloaded Files#
You can filter data in a widget before downloading a file (CSV or Excel). Use the widget Search function to filter for the data you wish to include in the downloaded file. The file will then only contain the filtered data.
Date Format for Downloaded Files#
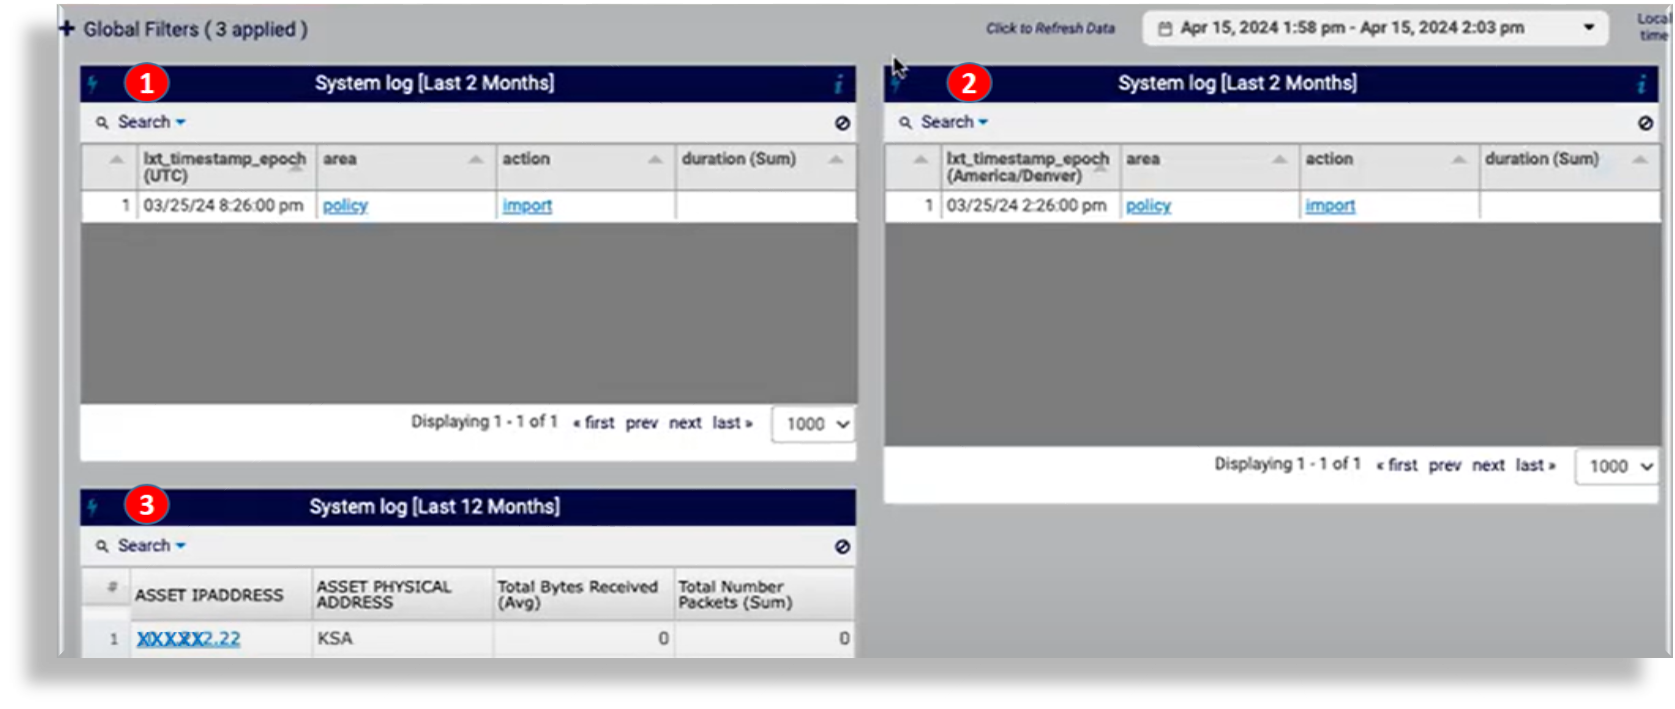
From the Widget Options menu, you can download CSV or Excel containing widget data. If you wish to download the file with a specific date format in the filename, you should be working with widget data in a Table 2 chart type. For Table 2 chart types, the date format also displays in the widget table header row.
The image displays Table 2 charts (marked 1 and 2), and a Table 1 chart (marked 3):
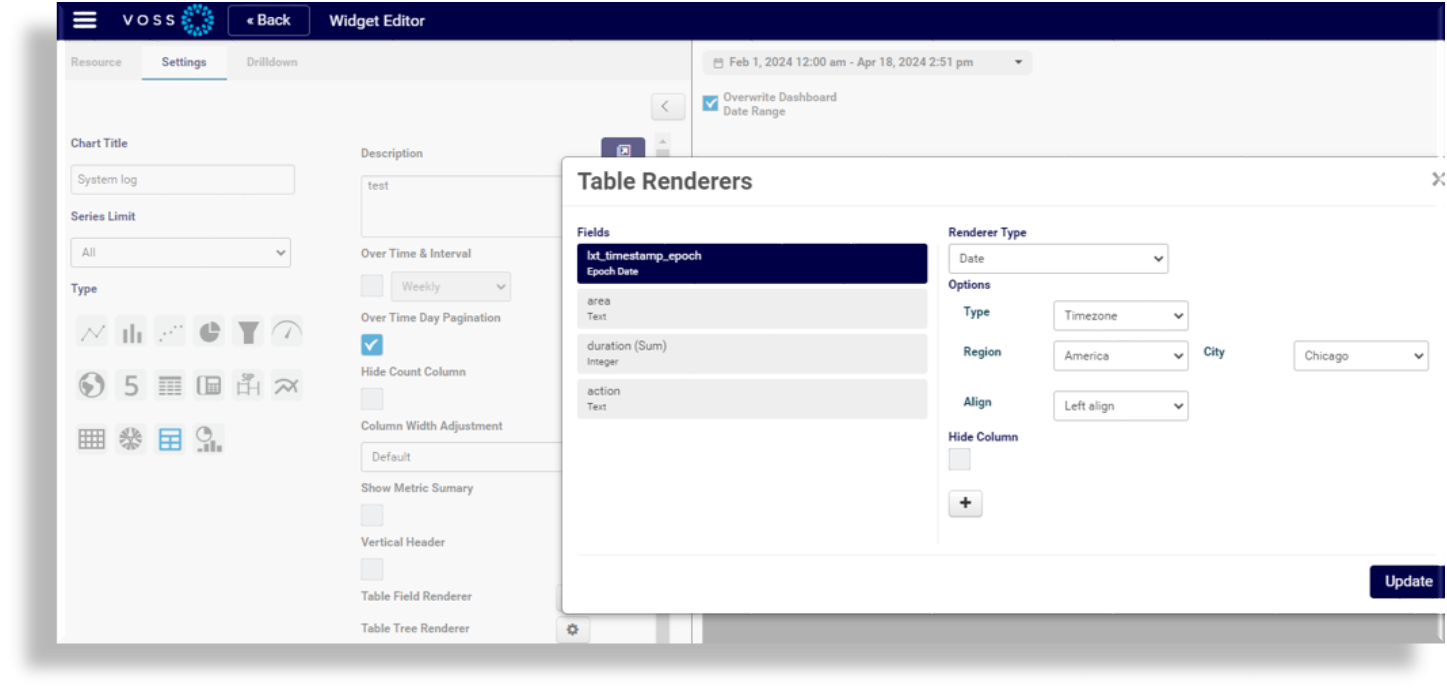
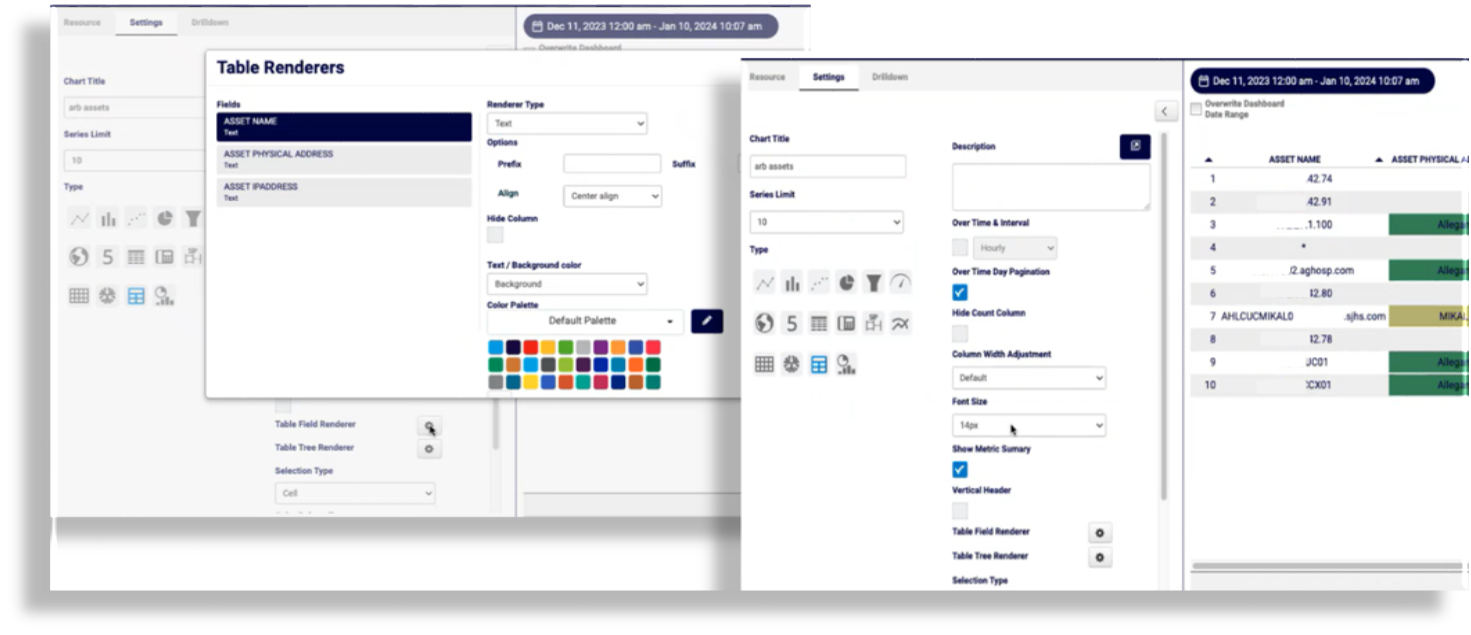
For Table 2 type chart widgets, you can set up the date format for the table - either UTC, local time, epoch, or a specified regional timezone. Date format is configured via the Widget Editor. On the Settings tab, click the cog icon at Table Field Renderer, and in the Table Renderers dialog, change Renderer Type to Date, then choose a date format type. When selecting Timezone, you can also choose the region and city.
The image displays the date format settings in the Table Renderer dialog:
Related Topics
Widget Editor#
The Widget Editor provides options for configuring data resources, settings for configuring how data displays, and drill down options. Configuring a widget in this way provides several powerful data analysis options.
To launch the Widget Editor:
Open a dashboard.
Click the Vertical Ellipsis icon
 at the top right corner of the
widget you wish to edit, to display the Widget Options menu.
at the top right corner of the
widget you wish to edit, to display the Widget Options menu.Select Edit Widget.
Update the widget via these tabs:
Chart pane in the Widget Editor
The panel on the right (the chart pane) on the Widget Editor page, displays data based on the widget configuration.
Note
If the widget you open for editing contains pre-existing configuration and data, this data displays in the chart pane without running additional queries. This means that you can view configuration changes immediately, based on pre-existing data.
The table describes the chart pane configuration options:
Configuration |
Description |
|---|---|
Date range calendar |
Select a date range for the data you wish to analyze. |
Overwrite Dashboard Date Range |
Define whether to allow the widget date range to overwrite the dashboard date range. |
Auto Query |
Define whether to allow automatic queries. If you have this setting enabled, the system automatically runs the query to refresh data when you update the widget configuration. Disable this setting to limit the number of queries, and to only run the query manually once you complete the configuration. In this case, you’ll click the Query button to run the query when you’re ready to do so. |
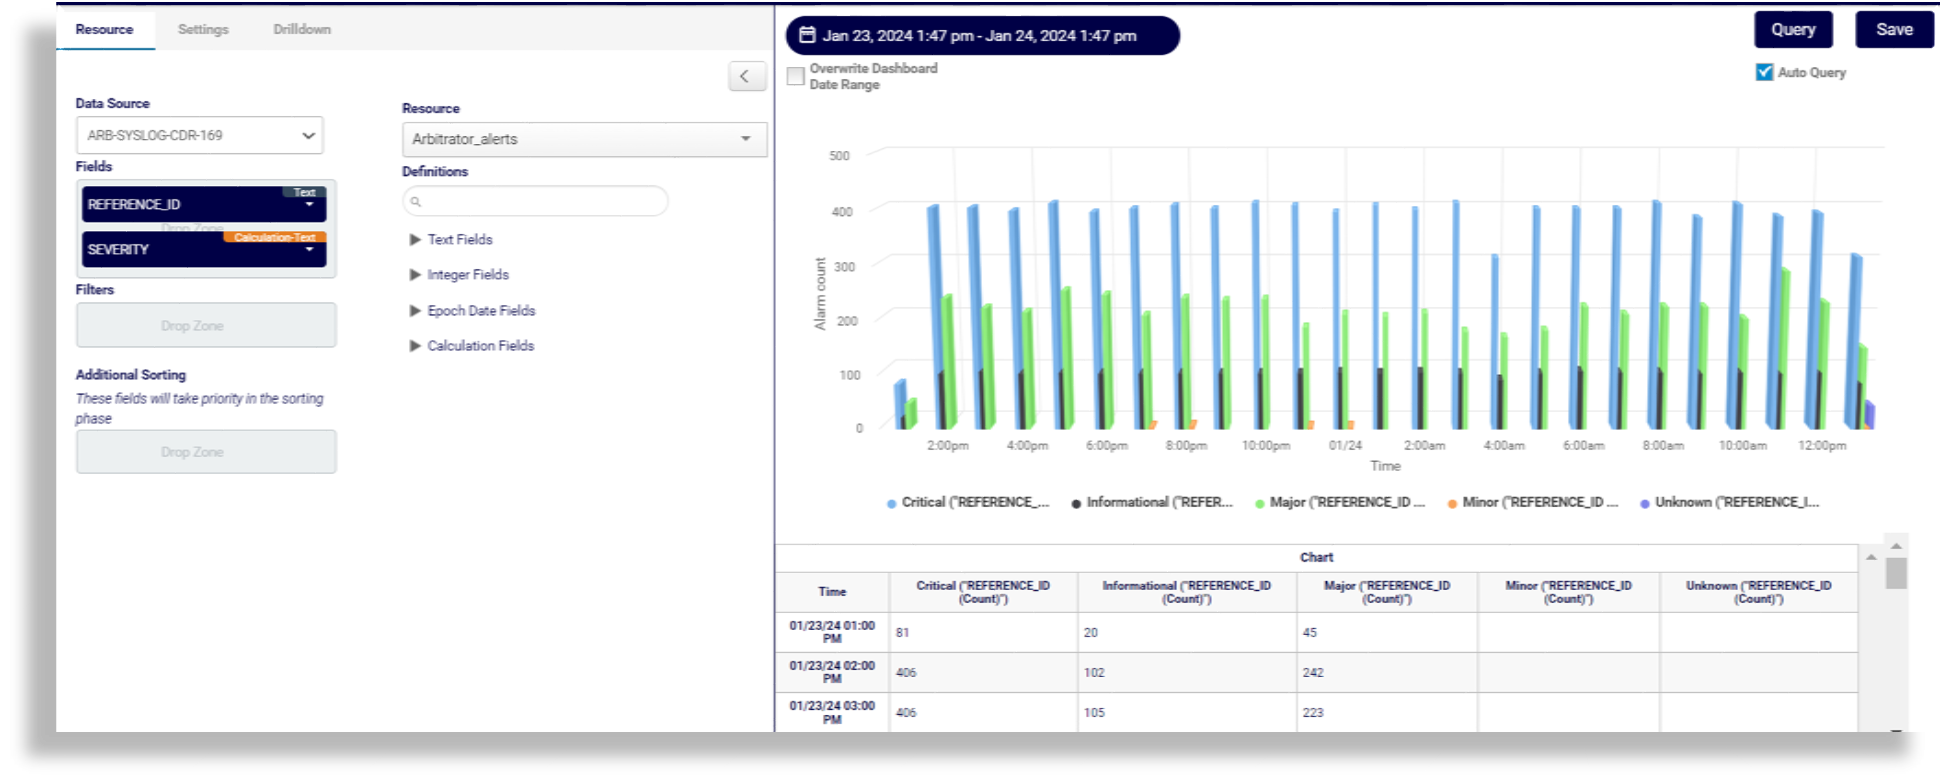
Resource Tab#
This tab configures the widget’s data sources, search definitions, fields, filters, and sorting.
The table describes the fields on the Resource tab:
Field |
Description |
|---|---|
Data Source |
This drop-down lists all the databases to which the VOSS Insights platform has access. This can be its local database or it can contain multiple databases. |
Resource |
This drop-down lists existing resources. When editing an existing widget within a dashboard, the default name is the search definition used for that dashboard. However you can use this to pull data onto a widget from any defined search definition, thus creating a dashboard of widgets that analyze data from multiple data sources (Ex: Firewall, DNS, Router, Application) Data definitions are also available for:
|
Fields |
Drag fields from Definitions that you want to analyze on the widget. You can add as many fields as required to a single widget. |
Definitions |
Definitions are categorized by type (Text fields, Integer fields, Float fields, Epoch Date fields, Calculated fields, and Filter Only fields), based on the data type extracted from the search definitions previously created and associated with the widget. First choose a resource to filter the field types and fields associated with the definition, then you can drag the required fields into the Fields panel on the left. |
Filters |
Allows you to set a filter definition for the widget. For example, filter only on values greater than 200. These filters allow the widget to be created to provide analysis of the data based on the specific context. Drag and drop fields here that you want to use as filters (from Definitions). |
Additional Sorting |
Allows you to set the starting order for fields that appear in a table. Using this field allows the column sort to be pre-set based on the fields dropped into this panel. Drag and drop fields here, from Definitions. |
Note
Where dates are listed, the zero (0) value is not interpreted and shown as Jan. 1, 1970, but simply as 0.
Related Topics
For more information around working with fields on the Resource tab, see Widget Editor - Fields
For more information around working with filters on the Resource tab, see Widget Editor - Filters
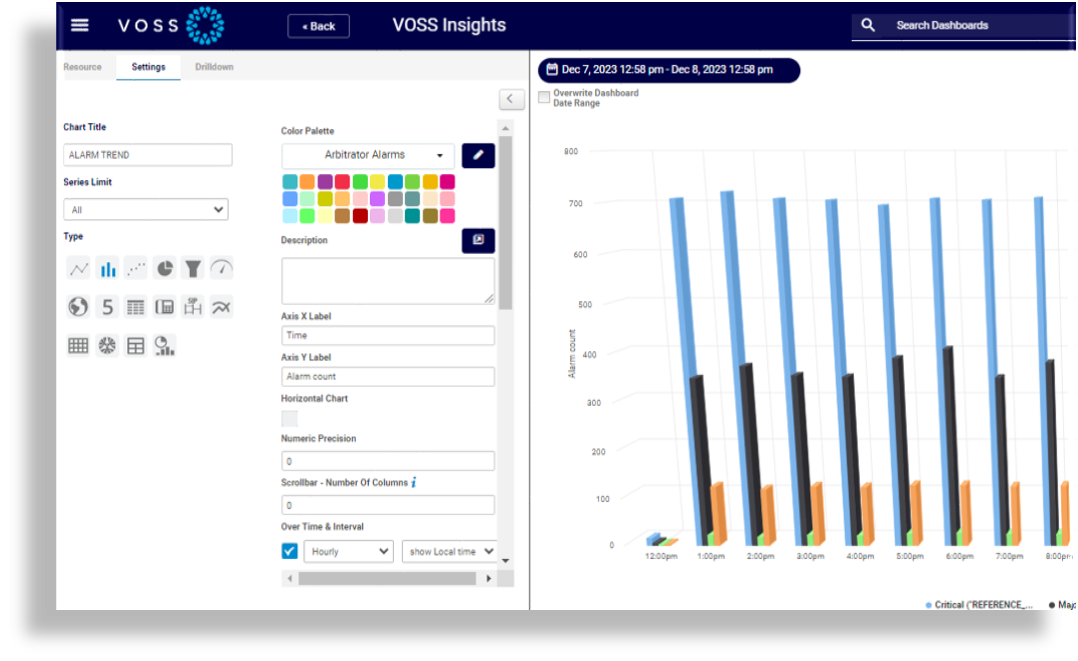
Settings Tab#
This tab configures settings for widget data for charts, counters on cards, and tables:
Charts
You can change the chart title, description, series limit, chart type, and chart colors. Additional configuration fields on the tab are based on the chart type you choose.
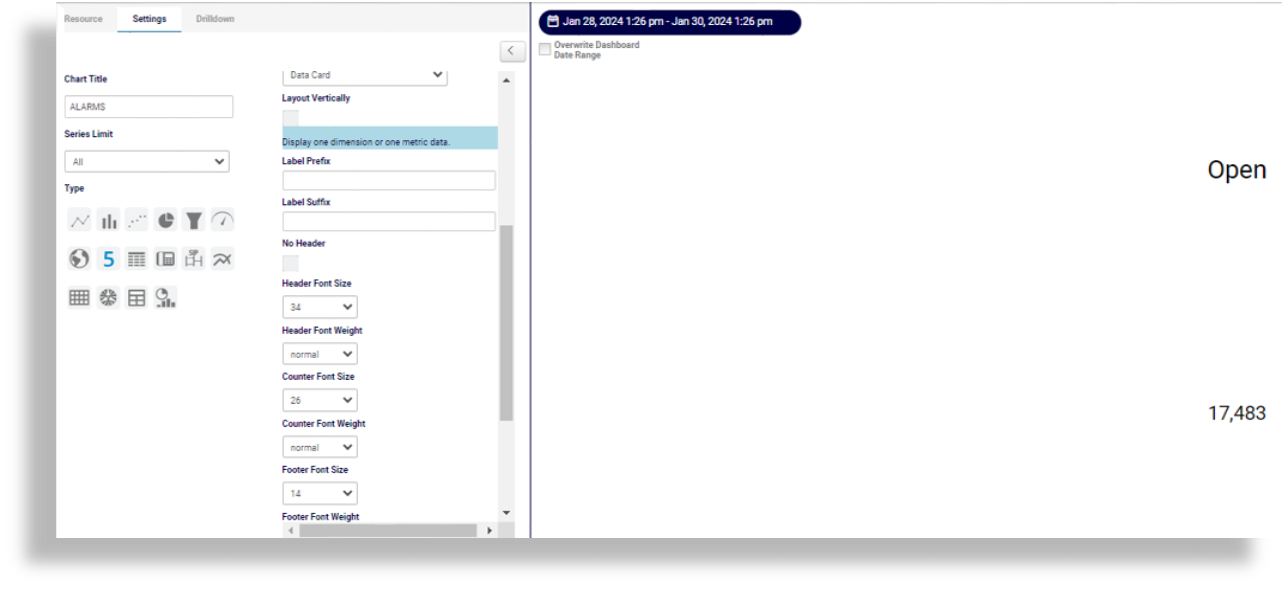
Cards with counters
Change the size and color of fonts for headers, counters, and footers. You can also choose to remove headers on the card, if preferred.
Tables
Change font sizes, and the background or text color in fields.
Related Topics
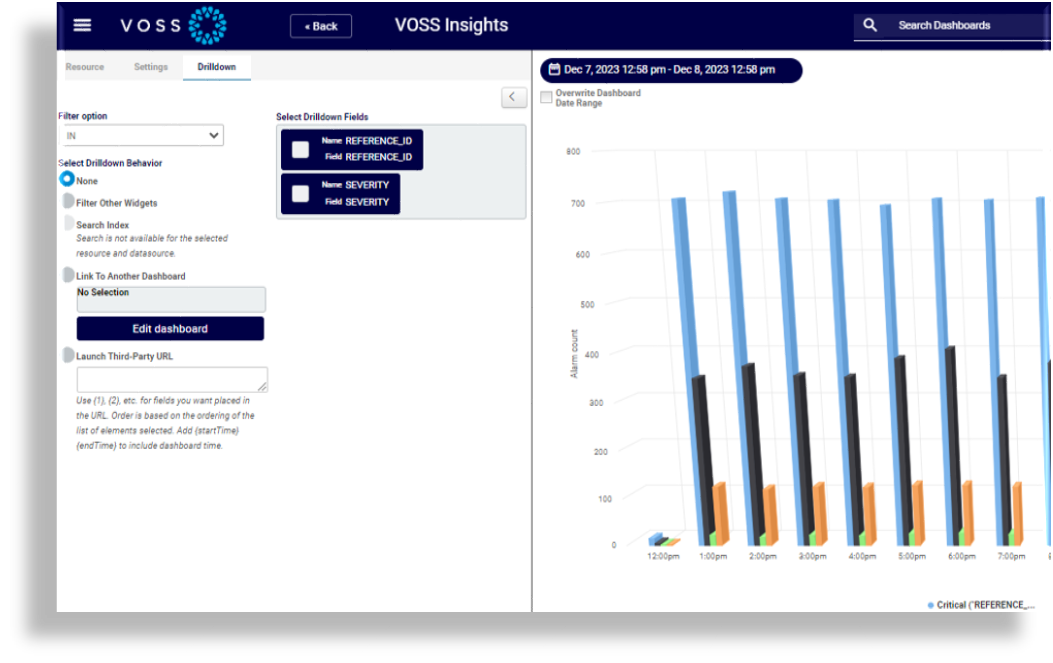
Drilldown Tab#
This tab defines the drill-down field behavior and allows you to choose the fields that will display as drill-downs.