Arbitrator Main Interface#
Overview#
The Arbitrator GUI has two sections. The main interface displays on first log in, while the System Configuration GUI, accessed via the Wrench icon on the main interface toolbar, is accessible only to admin users.
You can select the following functionality via the toolbar icons on Arbitrator’s main interface:
Related Topics
Asset Explorer#
Overview#
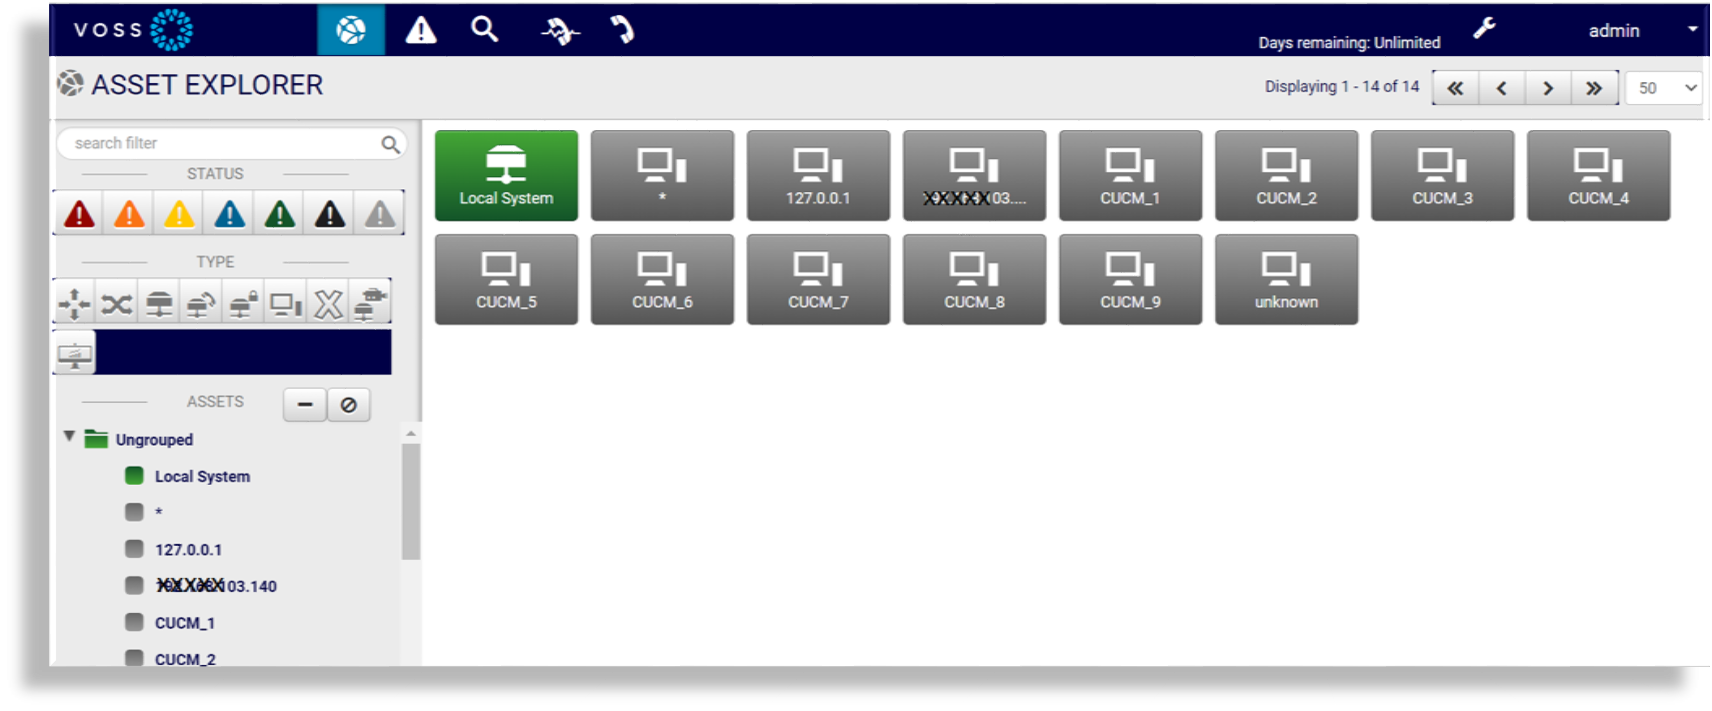
The Asset Explorer tab lists devices created as assets in Arbitrator, displaying up to 100 assets per page. On this page you can also view the alert severity status of each asset, and click on an asset to view further details.
Note
If you have more than 100 assets, use the toolbar paging icons to display the next increment of assets.
Asset Alert Severity Status
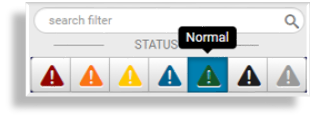
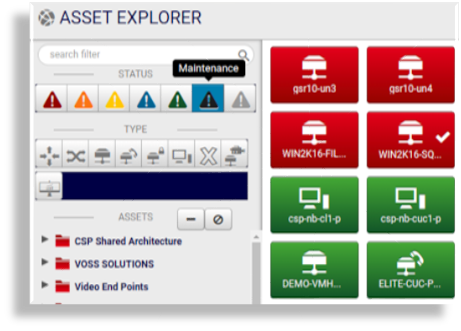
Assets display the color of the current highest-level alert for that asset in the system.
Color coding is used to indicate the alert severity status of each asset:
Critical (Red)
Major (Orange)
Minor (Yellow)
Informational (Blue)
Normal (Green)
Maintenance (Black)
None (Gray)
Assets Search Filter
You can apply a search filter in the Asset Explorer to display only relevant assets (assets matching specified filters). You can filter assets by:
Alert severity level, including maintenance mode
Asset type
Asset groups
Keyword
Asset Details#
Click on an asset in the Asset Explorer to open a summary of that asset’s alarm statistics on the Asset Details page.
You can select the following tabs on the Asset Details page:
Alerts
Probes
Search
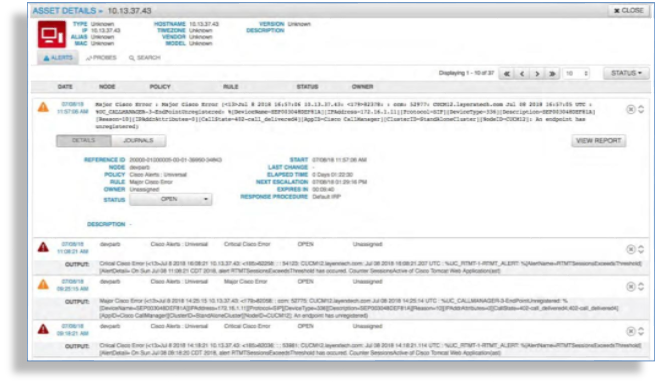
Asset Details - Alerts Tab#
The Alerts tab displays all alerts associated with the asset and allows you to disposition, add alert journal entries for the alert, and see a report of the alert and events.
(See Alert Disposition, Alert Journal and View Report within the :ref:`arb-alert-analyzer`section)
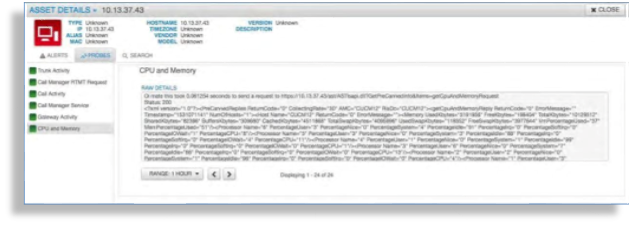
Asset Details - Probes Tab#
The Probes tab displays all probes associated with the asset. Clicking on each probe displays the probes output. If output is a numerical value, such as CPU usage, then a graph will be displayed of that value over time. If the probe output is non-numerical then just the last probe output displays.
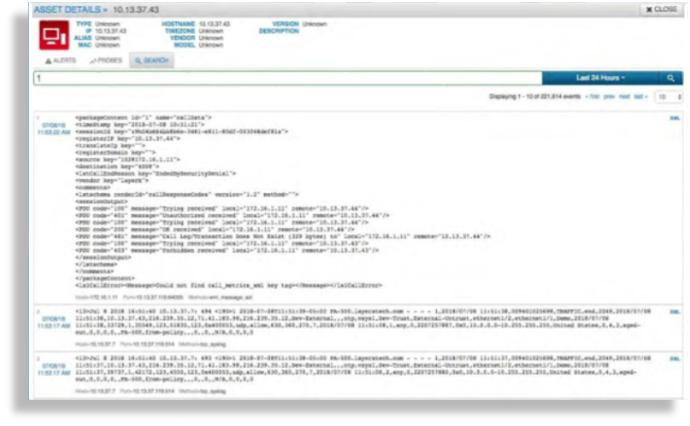
Asset Details - Search Tab#
The Search tab contains an event search bar tied to the data associated only with this asset. This allows you to search all logs/events by this asset versus the entire index data store. (See Event Search for more details)
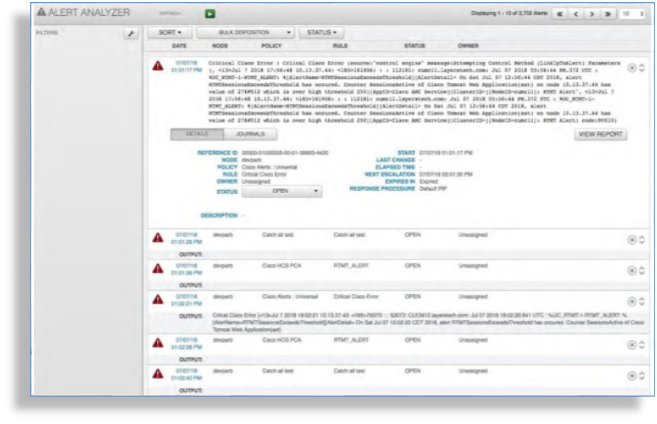
Alert Analyzer#
Overview#
On the Alert Analyzer page you can view all alerts coming into the system based on a first in/last out presentation. You can view older, existing alerts, as well as viewing alerts as they occur. You can disposition alerts based on activity, and view a report details associated with a specific alert. Several filter and sort options can also be applied.
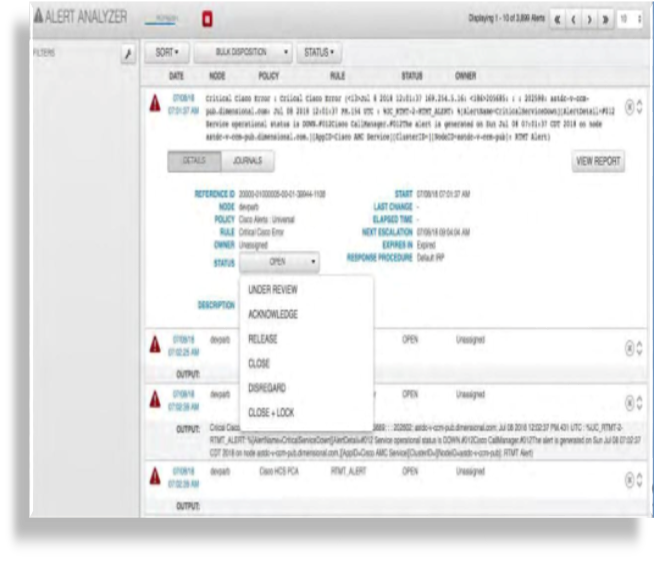
Disposition#
Disposition allows you to set the status of each alert, either one at a time, or in bulk.
The table describes the options for alert disposition:
Option |
Description |
|---|---|
Open |
Indicates a new alert. |
Under Review |
Indicates that the alert has moved out of the Open state and the alert journal can still be edited. |
Acknowledge |
Indicates that the alert has moved out of the Open state and the alert journal can still be edited. |
Release |
Indicates that the alert has moved out of the Open state and the alert journal can still be edited. |
Close |
Indicates that the alert has moved out of the Open state and the alert journal can still be edited. |
Disregard |
The alert is deleted from the system. |
Close + Lock |
Indicates that the alert has moved to a Closed state and the alert journal cannot be edited. |
Disposition a Single Alert
Expand the alert to open it (click the up/down arrows to the far right of the alert).
From the Status drop-down, select the disposition state.
Bulk Disposition Multiple Alerts
This procedure dispositions a group of alerts at once.
Apply the required filter to the alerts - use the Filter Manager (see Alert Filters).
Once you have the group of alerts filtered, choose the required disposition state from the Bulk Disposition drop-down.
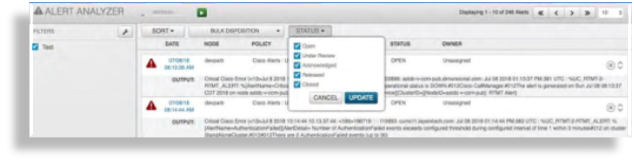
Filter by Disposition
Click the down-arrow at the Status drop-down.
Select a disposition status.
Click Update to apply the filter to see only those alerts with the disposition status you’ve selected.
View alerts, filtered by the selected disposition status.
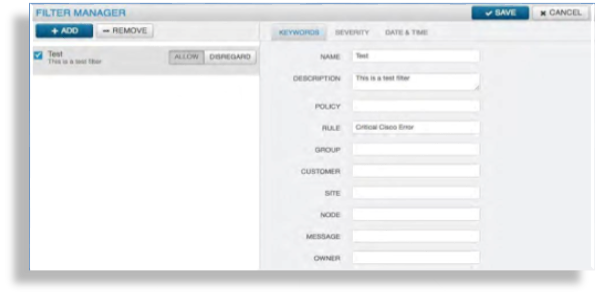
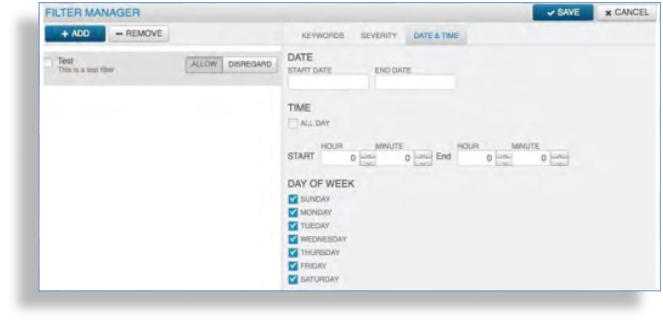
Filter Manager#
You can apply filters to alerts to view only a subset of alerts. You can filter by keywords, severity, and by date and time.
On the Alert Analyzer page, click the Wrench icon in the Filters pane to open the Filter Manager.
Click the Plus icon (+) to add a new filter.
Fill out filter criteria across the tabs: Keywords, Severity, Date & Time:
On the Keywords tab, fill out a name and description for the filter, then fill out filter criteria, which can be any or all of the following: correlation policy, correlation rule, group name, customer name, site, node, owner, or message
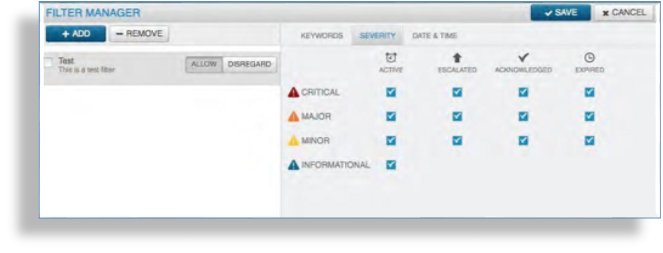
On the Severity tab, select one or more severity states:
Active: Alert is currently in one of the active states
Escalated: Alert has been escalated based on the timer in the correlation rule
Acknowledged: Alert is in an acknowledged disposition state
Expired: Alert has expired based on the timer set in the correlation rule
On the Date & Time tab, set a date range for the filter, either “All Day”, a specific start and end time, a day of the week, or any combination.
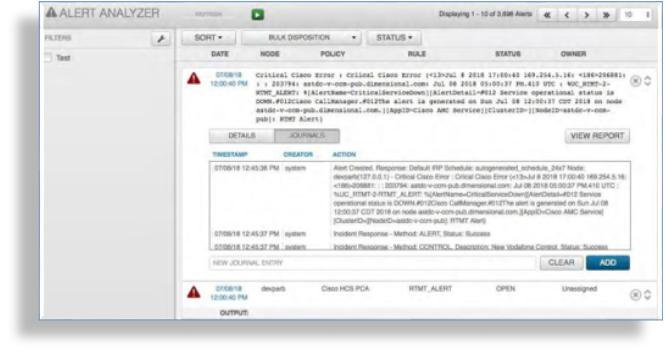
Alert Journal#
The Alert Journal displays the alert history as well as system and user actions. Users can add journal entries to update status or actions.
Add an Alert Journal
On the Alert Analyzer page, click the Pause button to stop the automatic refresh.
Expand the alert where you want to add an entry.
Click Journals, then fill out a journal entry in the field displaying the text, NEW JOURNAL ENTRY.
Click Add.
Click the Play button to resume refresh on the Alert Analyzer.
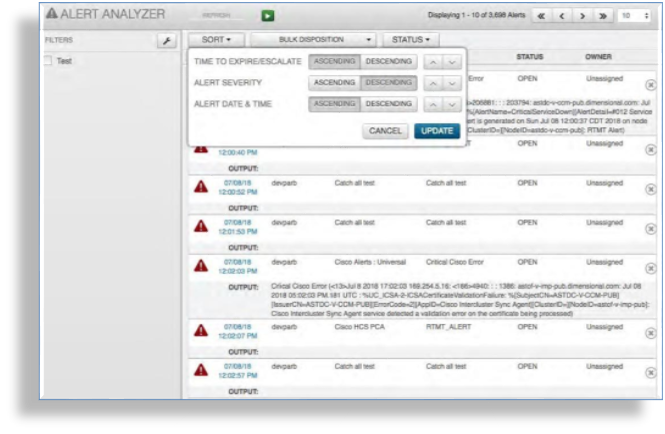
Alert Sort#
Alerts in the Alert Analyzer can be sorted based on the following categories:
Time to Expire/Escalate
Alert Severity
Alert Date & Time
The sort order for each category can be toggled between ascending and descending. Additionally, the order of each sort category will be the first to last in priority. To change this, click the down arrow or the up arrow adjacent to each category.
Search#
Overview#
Arbitrator’s main interface provides the following search options:
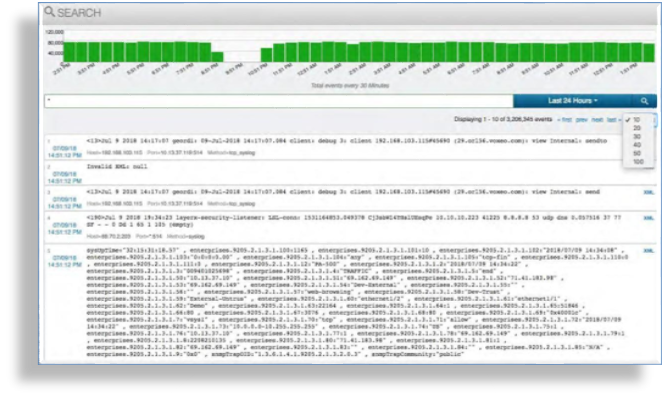
Event Search#
The Event search view provides access to all raw data coming in to Arbitrator and provides a simple interface to search for and display results.
Arbitrator builds a dictionary of all words from all received logs, enabling rapid search across large volumes of data, making an otherwise complex amount of data quickly searchable and more useable.
Simple Search#
To perform a simple search across all logs based on the default time of “Last 24 Hours”, use the “*” wildcard character.
In the search text input field type
*Press Enter, or click the magnifier icon.
View search results, which displays all log data received in the last 24 hours.
The default number of logs per page is 10, but can be increased via the drop-down below the time bar.
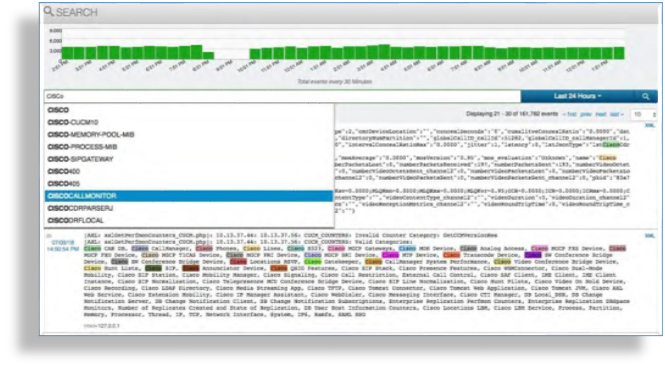
Keyword Search#
To perform a keyword search across all logs based on the default time of “Last 24 Hours”:
Fill out a word or part of a word that you know is present in your data, such as “Cisco”.
The event search auto suggests a keyword as you type, based on data the Arbitrator has collected.
Press Enter to select the auto-suggested word, or click the Magnifier icon to run the search.
View search results, which displays all log data from the past 24 hours that contains the specified criteria.
The default number of logs per page is 10. To increase the number of logs per page, select the required number from the drop-down below the time bar.
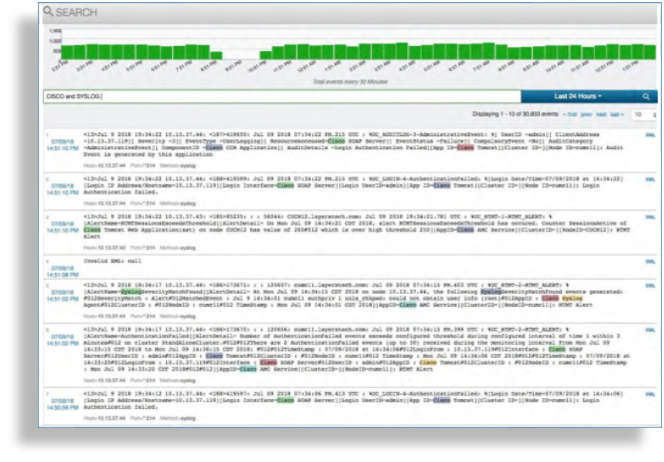
Use Operators with Search#
The Event Search allows the use of operators (AND, OR, NOT) to combine keywords that
you know are present in your data for a more granular search. A search with operators
searches across all logs based on the default time of “Last 24 Hours”.
Fill out a word or part of a word that you know is present in your data, such as “Cisco”, followed by the relevant operator (
AND,OR,NOT).Note
When using operators, the logic must match in order to retrieve data.
Select a keyword from the auto-suggest, or press Enter to run the search.
View search results, which displays all log data from the past 24 hours that contains the specified criteria.
The default number of logs per page is 10. To increase the number of logs per page, select the required number from the drop-down below the time bar.
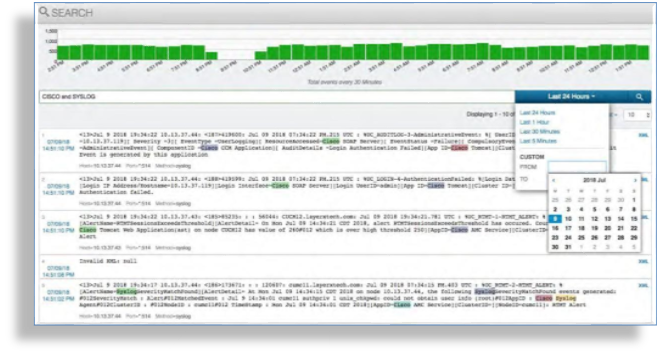
Date Range Search#
You can search for and apply a date to any of the possible search types discussed in this section.
The default is the last 24 hours, or choose an option from the drop-down:
Last 24 Hours: The default
Last 1 Hour
Last 30 Minutes
Last 5 Minutes
Custom date range showing from and to. Clicking in the “From” box opens up a calendar from where you can select a specific “From” date. Clicking in the “To” box will do the same.
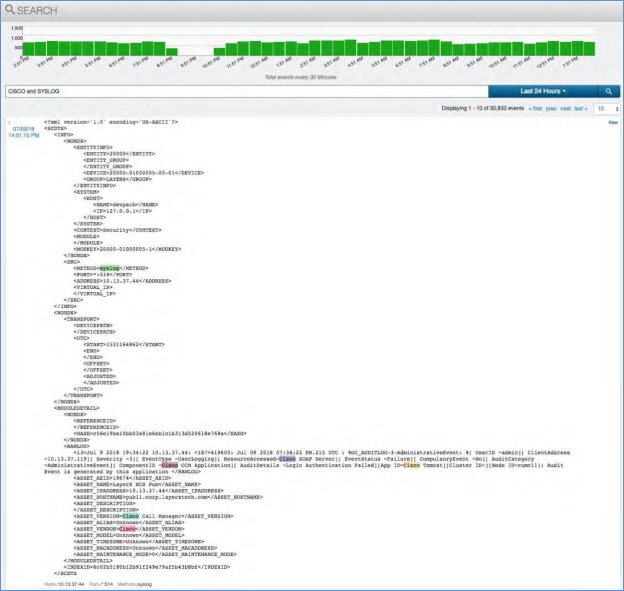
Search Result Metadata#
The event search engine uses Arbitrator’s core processes to store, tag, and manage data.
Click on the blue text (“XML”) that displays with each log entry to open up an XML representation of the data along with additional important elements, specifically, the entity ID’s, which make every event unique and formulates the “Reference ID” seen on the Alert Analyzer page. For compliance purposes, a hash of the raw log is also available, if required.
To return to the main search page, click Raw.
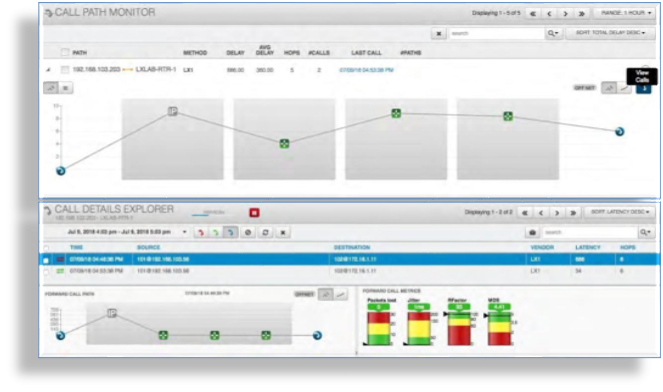
Call Path Monitor#
Arbitrator’s Call Path Monitor allows you to manage unified communications, and the particular call path that a Voice over IP call (VoIP) takes. It displays the paths or routes that a call takes from source to destination. Each path contains the IP Addresses, number of hops, delay, and latency during the call.
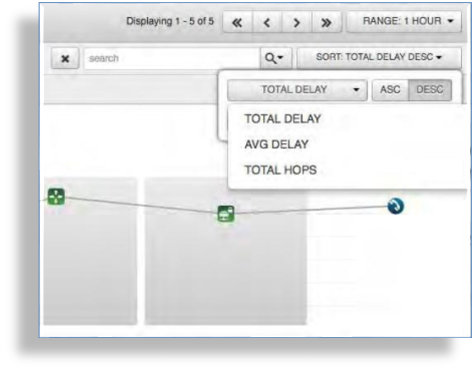
Sorting Call Paths#
The Call Path Monitor provides three options for sorting data on the page and for represented call paths:
Total Delay |
The total latency on the call. |
Average Delay |
The average latency on the call. |
Total Hops |
The total number of layer-3 hops the call took. |
For each sort option, you can also choose to view the data in ascending or descending order.
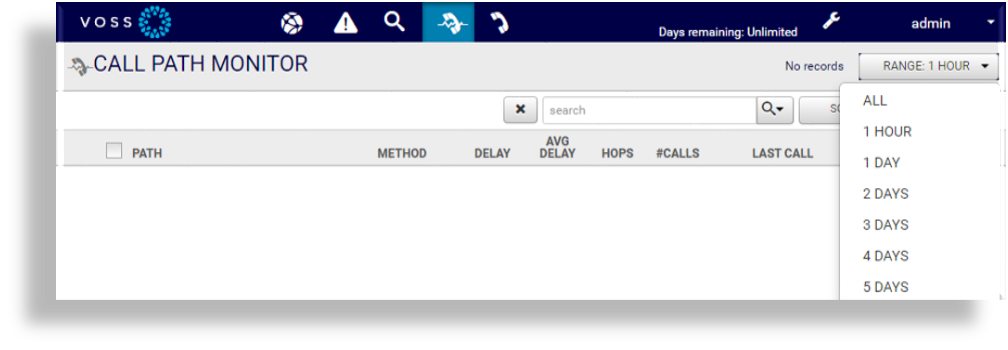
Call Path Time Range#
The Call Path Monitor time range setting allows you to define the time range for which you wish to view collected call paths. The Range drop-down provides the following options:
All
1 Hour
1 Day
2 Days
3 Days
4 Days
5 Days
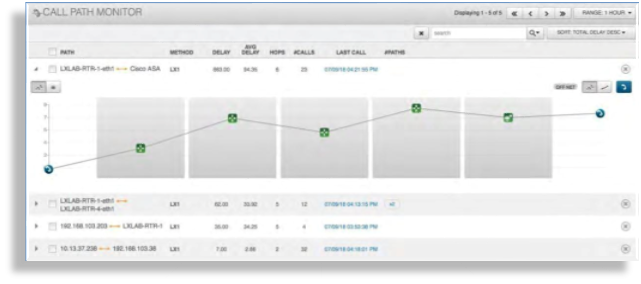
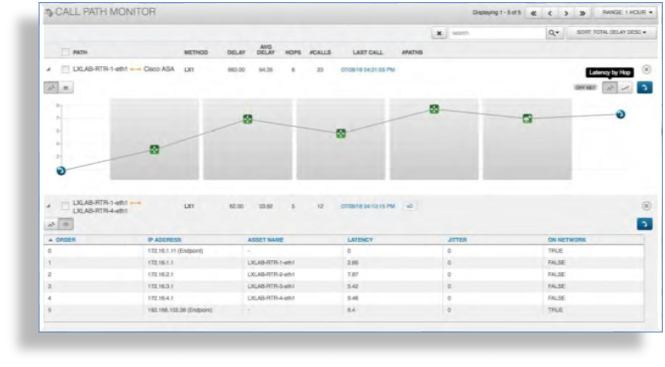
Expanded Call Path View#
Expanding a call path allows you to see the path by hop or by IP Address. In addition, it provides an option to view it by the total per hop or cumulative delay, latency, and Jitter. The expanded view also shows you whether the call was ON Network or OFF Network. The expanded view can be toggled to show in graph or table views.
To expand a call path and toggle between graph and table views, click the arrow adjacent to the relevant call path.
By default, the view is in graph mode. To switch to the table view, choose the table view icon in the upper left corner of the now expanded call path.
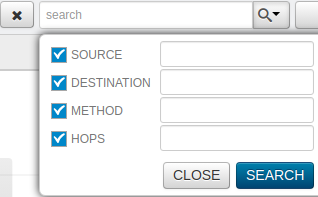
Searching Call Paths#
Each call path has several fields you can use to search and filter for a relevant call (one or more).
Source
Destination
Method
Hops
View Call Details from the Call Path#
In the Call Path Monitor you can drill into the specific call details directly from the chart.
Click the blue Phone icon in the path row to open the Call Details Explorer view for that call path.
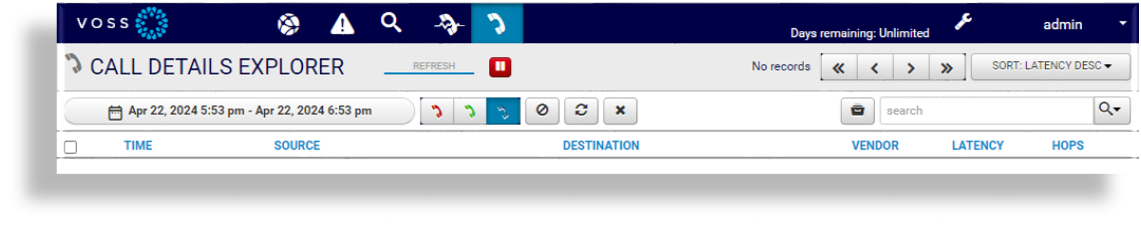
Call Details Explorer#
The Call Details Explorer is the main page for managing unified communications and the details of a particular call path that a Voice over IP (VoIP) call takes. This page displays the time, source destination, vendor, latency, and hops (at the top of the page). The bottom pane displays the call path with each hop, along with the call metrics, such as packets lost, jitter, R-Factor, and MOS.
Call Details Explorer Toolbar
The table describes the functional elements on the Call Details Explorer toolbar:
Element |
Description |
|---|---|
Filter by date and time |
The date and time calendar allows you to search call details for a specified date and time range. You can select a date and time from the calendar, or select from a range of predefined options, from Last 5 Minutes, to Last 12 Months, or for the previous hour, day, or week. |
Filter by call quality |
The Phone icons allow you to filter your data to view only good calls, only bad calls, or view both good and bad calls.
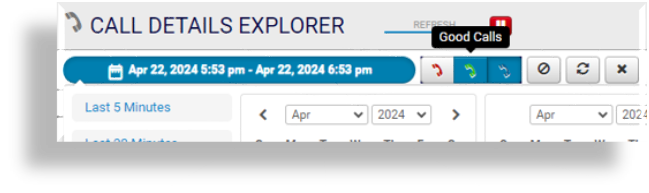
|
Clear Filters |
Removes all applied filters and displays call details in the default display mode. |
Update |
Applies a predefined refresh timer to the page. Click Update to request new data, on demand. |
Delete Selected Calls |
Deletes any call selected on the page. |
Refresh, Play, or Pause Data |
Click the Pause/Play icon to pause or restart the data refresh cycle. This is useful when reviewing a specific call. |
Sort |
Provides the following sort options for call details. You can sort by:
You can sort each option in ascending or descending order. |
Search |
A free text search field that also has options to use predefined criteria, either of the following:
|
Element |
Description |
|---|---|
Call Management Configuration |
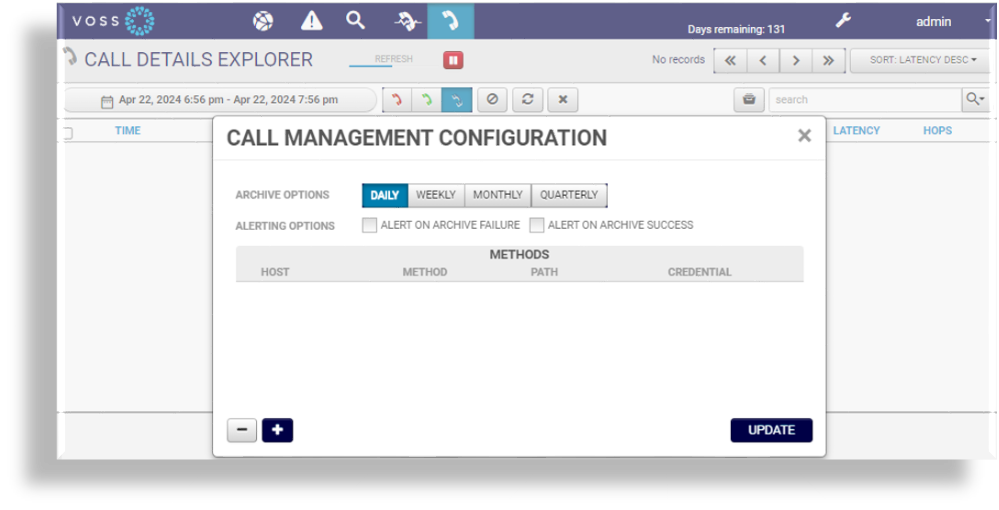
Click the File icon adjacent to the Search bar to open the Call Management Configuration dialog, where you can configure settings to manage the call table on the Call Details Explorer page. In very busy or large environments it is imperative that you manage the data being collected in the Call Detail Explorer. Having potentially thousands of calls can lead to the data becoming difficult to manage. These settings provide optional time and methods for which call data can be archived. Options are daily, weekly, monthly, or quarterly. Ensure that you toggle on Alert on Archive Failure, and Alert on Archive Success. Available archival methods are SCP, SFTP, or SMB. Each requires a host, path, and credential. Multiple methods may be added. |
The image shows the Call Management Configuration dialog: