
Welcome to Insights Dashboard#
Overview#
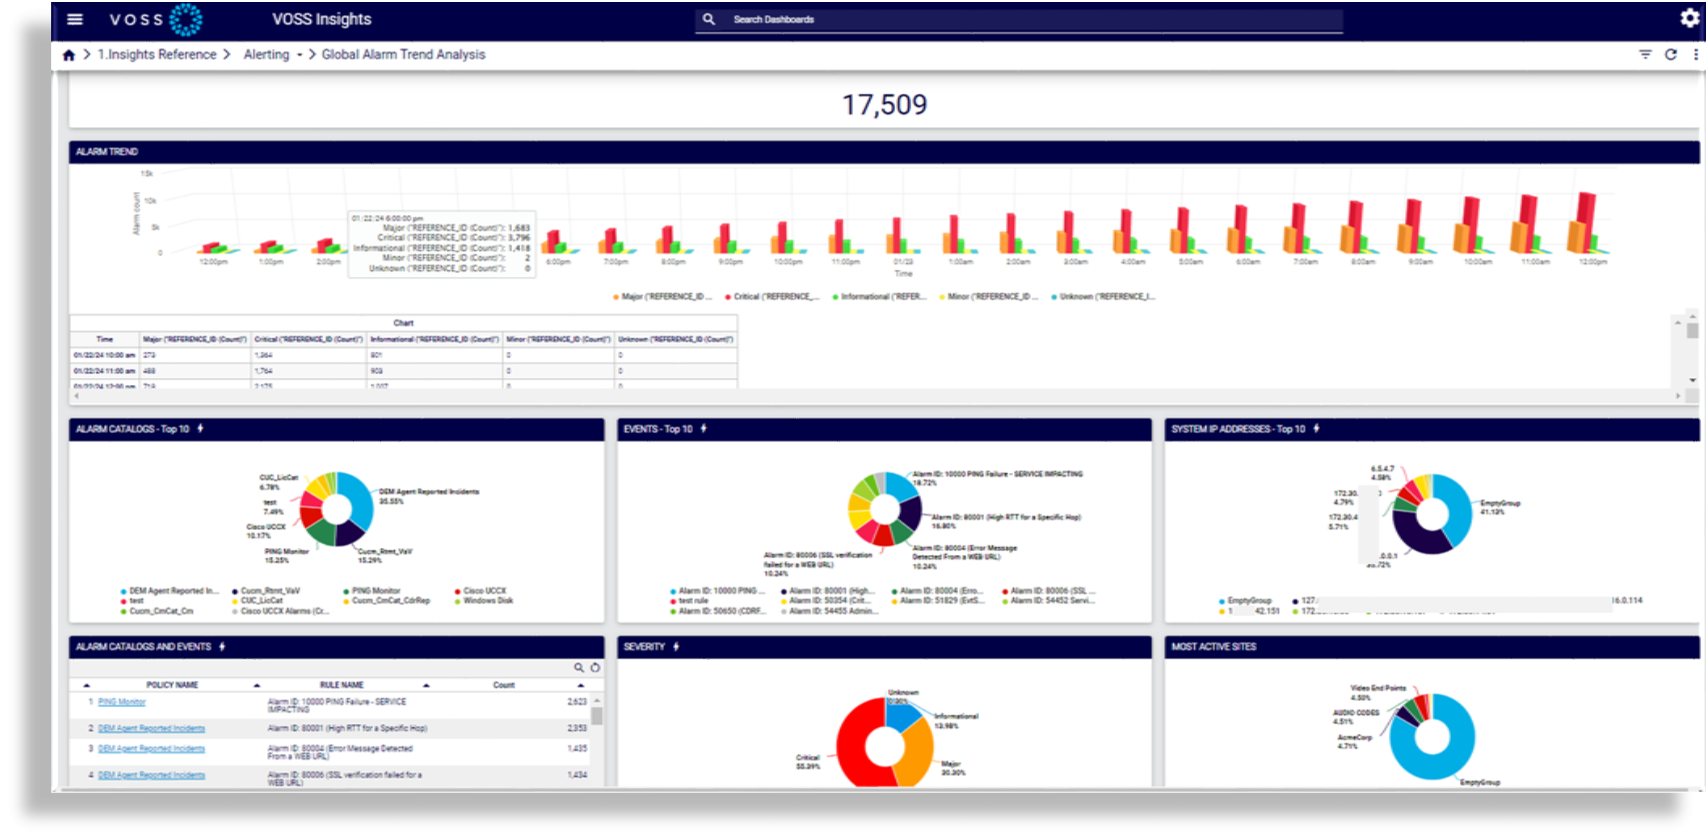
Insights Dashboard (Reporter) is a log analytics platform that allows multiple data sources and log formats to be consumed, extracted, analyzed, and displayed on dashboards, and to produce reports from the dashboards.
The system ships with several default dashboards, which you can copy (clone) and edit to create your own custom dashboards, and you can create new dashboards from scratch.
This guide describes how to use and manage the Insights Dashboard platform, and includes details for the following:
Importing existing dashboard templates
Configuring new dashboards and widgets
Cloning existing dashboards
Ad-hoc report printing
Scheduling reports
Searching logs
Building search extraction queries
Troubleshooting issues by analyzing the logs being collected
The Insights platform design allows it to be used in multiple workflows. This guide describes the system elements that must be configured in a particular order, but there is no overall prescribed linear flow that must be followed.
Related Topics
Conventions Used in this Guide#
Some Insights topics display a badge to indicate that functionality is only available to administrator users.
admin-users-only
Dashboard User Interface#
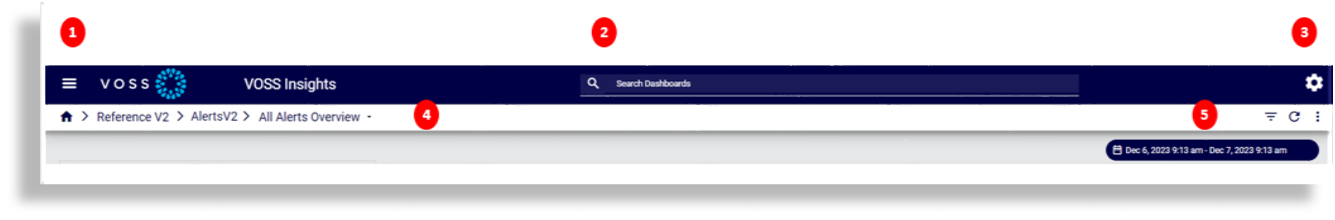
The table describes the elements that allow you to navigate and work with the Insights Dashboard system from the user interface:
Toolbar element |
Description |
|---|---|
Menu (Hamburger icon). Opens the dashboard library pane on the left of the GUI. |
|
|
Search for dashboards by their name from the toolbar Search field. The dashboard library opens with dashboards matching the search criteria. |
System Configuration (Cog icon). Displays a menu of options for configuring and working with the system, such as Import/Export Wizard, Manage Dashboards, Theme Management, Help, About, and Sign Out. Note Some options accessed via the System Configuration menu are accessible only to admin users, for example, Manage Forwarders, Configuration, Edit Account. |
|
|
Breadcrumb-like tab links provide a navigational aid for the dashboard library. Click the ellipsis (…) to open the entire folder tree, with the currently active folder highlighted in the tree, and the first dashboard in that folder, opens in the GUI. The dashboard that displays for the open folder has a drop-down where you can select additional dashboards, if available in that folder. |
|
|