Dashboard Server NetFlow Data Rendering Check
In a browser, connect to the Dashboard GUI, using a URL with the following format:
https://<IP address>
Log in to the system using admin credentials (admin / admin).
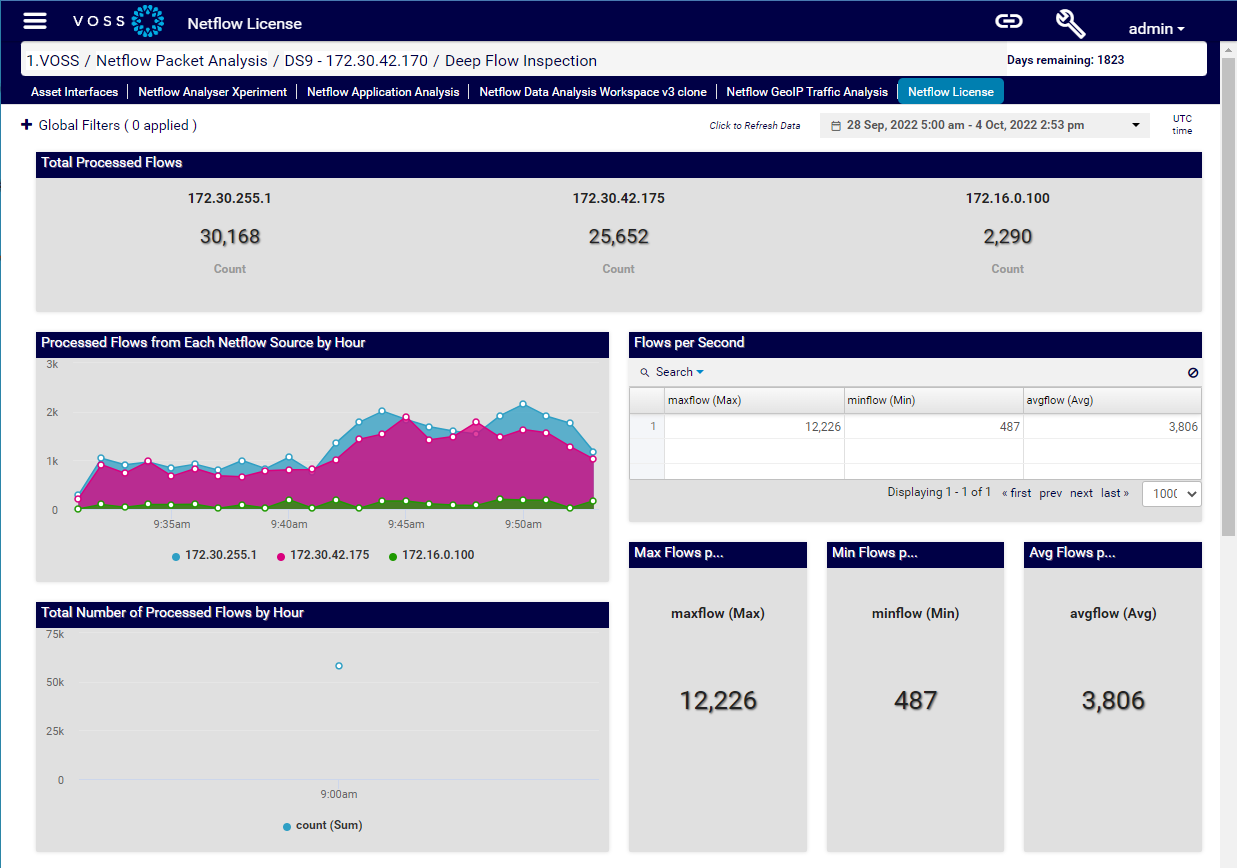
In the Deep Flow Inspection folder, select the NetFlow License dashboard.
Set the time frame for the data to be viewed, to the 1 hour time frame.
If you’re able to see data rendered in the tables and graphs in the NetFlow License dashboard, system connectivity to the DS9 Collector databases is validated, as well as DS9 NetFlow data ingestion.
If you’re able to see data displaying in any dashboard in the NetFlow Packet Analysis and Deep Flow Inspection folders on the Dashboard application, then both systems are functioning properly.