
Dashboard Server System Status API check
In a browser, navigate to the Dashboard System Status API, using a URL with the following format:
https://<IP address>/api/system/stats
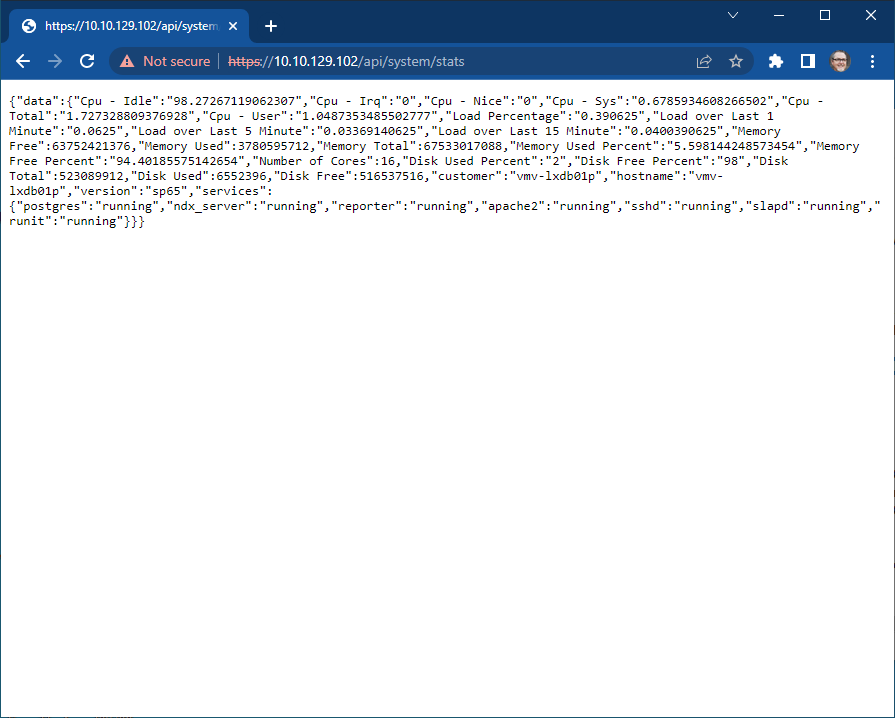
API output text displays system utilization statistics (CPU, RAM, Disk) and process status. All service status results should display as “running” for proper system operation.
API text output:
{"data":
  {"Cpu - Idle":"98.27267119062307",
   "Cpu - Irq":"0",
   "Cpu - Nice":"0",
   "Cpu - Sys":"0.6785934608266502",
   "Cpu - Total":"1.727328809376928",
   "Cpu - User":"1.0487353485502777",
   "Load Percentage":"0.390625",
   "Load over Last 1 Minute":"0.0625",
   "Load over Last 5 Minute":"0.03369140625",
   "Load over Last 15 Minute":"0.0400390625",
   "Memory Free":63752421376,
   "Memory Used":3780595712,
   "Memory Total":67533017088,
   "Memory Used Percent":"5.598144248573454",
   "Memory Free Percent":"94.40185575142654",
   "Number of Cores":16,
   "Disk Used Percent":"2",
   "Disk Free Percent":"98",
   "Disk Total":523089912,
   "Disk Used":6552396,
   "Disk Free":516537516,
   "customer":"vmv-lxdb01p",
   "hostname":"vmv-lxdb01p",
   "version":"sp65",
   "services":{"postgres":"running",
               "ndx_server":"running",
               "reporter":"running",
               "apache2":"running",
               "sshd":"running",
               "slapd":"running",
               "runit":"running"}}}