
Configure Windows Forwarder
Overview
The VOSS Insights Windows Forwarder configuration application provides a graphical user interface (GUI) for configuring the Forwarder. All settings are saved and retrieved from the Windows registry.
The current version of the Forwarder has multiple sources of data, including Windows event logs, files and disk space, Windows Registry, Event logs, Performance counters, Windows Services, Database queries, as well as the output of various commands.
The configuration application design reflects these data sources. For example, parameters for configuring the Forwarder are found in the Forwarder tab.
The main pane of the application displays the VOSS logo.
You can click an icon in the menu tree to edit any of the settings.

Note
The GUI toolbar is activated when any screen displays a list of items (files, commands, queries). You can either use the toolbar buttons or right-click in the list to display a drop-down menu.
Event Logs
The Event logs tab displays all the event logs available on a current system. Those logs that are selected for monitoring are checked.
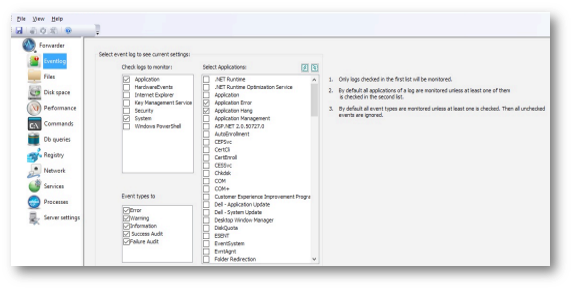
You will need to click on a specific event log in the Check logs to monitor list to view the selection for that log:
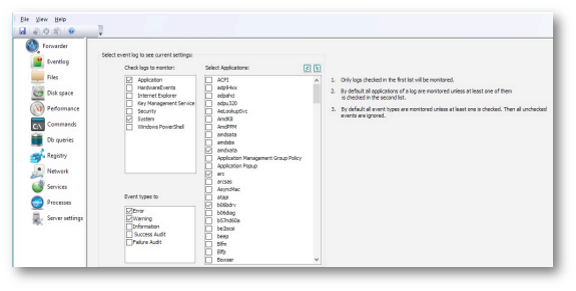
For each log, one or more of the five event types can be selected by checking the appropriate box in the Event types to monitor list.
By default, events of checked types are being monitored for all the applications in the system. You can select only those applications that have to be monitored by checking appropriate boxes in the Select applications list.
To summarize:
The Forwarder has three levels of configuration for event logs:
Select only those event logs that are of interest.
Select only specific event types for each log.
Select applications for each log.
This granularity is intended to reduce traffic between the Forwarder and the local Arbitrator/Dashboard appliance, and make troubleshooting easier.
Files
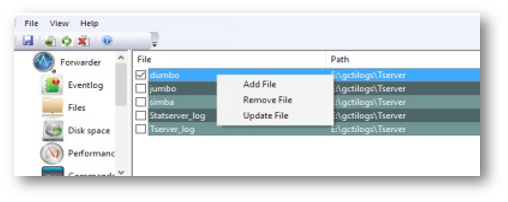
The Forwarder can monitor both flat files and named pipes. Each monitored file has to be added using the configuration program by clicking on an Add button.
Files already in the system can be reconfigured by right-clicking on a specific line. The pop-up menu, which displays after right-clicking on a line, allows you to remove the file altogether or change its settings.
To stop monitoring a specific file, you don’t need to remove it; just uncheck the relevant checkbox.
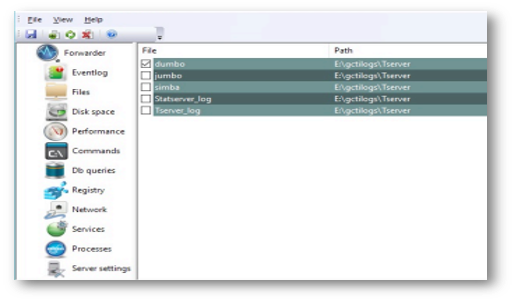
The same dialog box displays for both new and updated files.
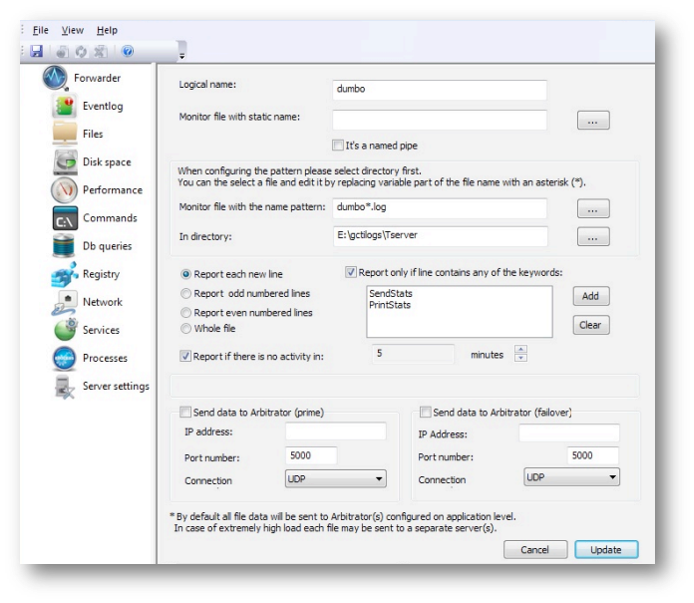
Logical name - Should describe the origin of the file. Its contents are completely up to the person configuring the application.
Monitor file with static name - click the Browse button adjacent to the field to select the file (even though file name can be typed in). The Browse button provides the opportunity to automatically populate the field with the file name and the directory name.
Monitor files with name pattern - Applies to a situation where the program creates a series of traces (files) in a specific directory, with a specific naming pattern. To configure monitoring of these files, click the Browse button adjacent to the field and select one of the files (it doesn’t matter which one). The system tries to find all or the instances of the files with a similar name. The resulting string should be fine tuned by the user. The permanent part of the name should be left intact and the variable part replaced by the
\*.
On this screen you can also choose which lines from the file will be processed. The selection can be applied based on sequential line numbers (all lines, odd lines, even lines), and based on specific keywords found in the line. The first option will handle traces where each line’s text description is followed by the line with a hexadecimal representation of data. The line is selected if any of the keywords in the list is found.
To update the File settings, right-click on a file and select Update File:
Disk Space
The Disk Space tab displays information about all the logical drives, along with their maximum capacity and current utilization. It allows you to set an acceptable free space limit for each device. The Forwarder raises an alarm once the limit is reached. The free space may be set as either a percent of total capacity or an explicit amount of space in megabytes.
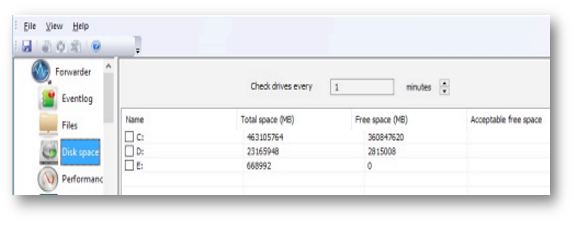
The last option on this screen relates to reporting absence of activity in the current file to the local monitoring appliance. There are situations when we can presume that a specific application is malfunctioning if it is not writing anything to the trace. This option would allow us to raise a red flag under these circumstances.
Performance Monitoring
The Performance Monitoring tab displays all performance counters currently monitored by the Forwarder. When the configuration application is first launched, the list includes all predefined counters.
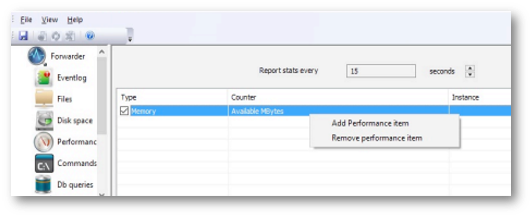
The Performance Monitoring program collects the list of all the counters available and saves them in a list that serves as a basis for adding new counters:
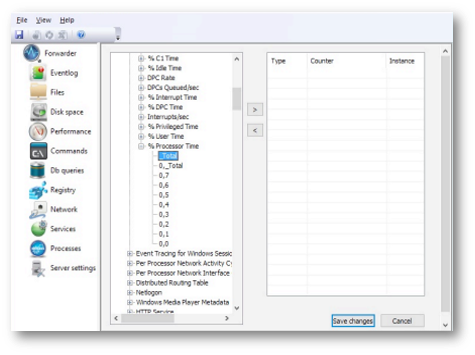
Click the right-pointing arrow (>) to add a selected counter to the list. Click the left-pointing arrow (<) to remove it from the list.
Commands
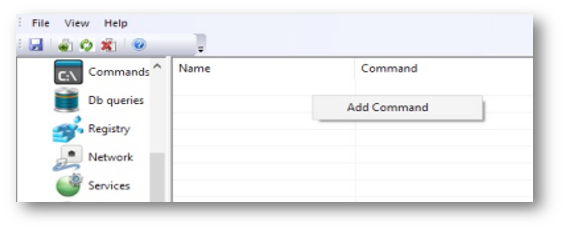
The image shows the dialog that displays when adding a new command or when modifying an existing command:
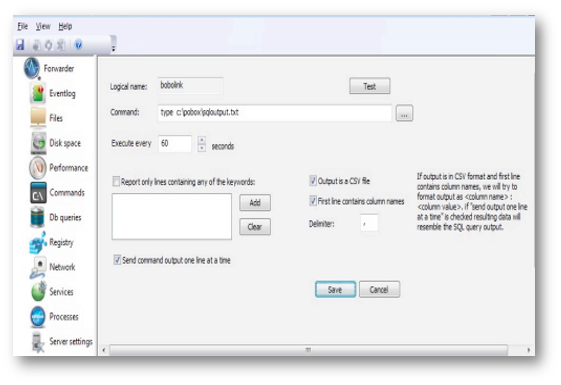
Special features have been added to handle the output from commands that produce CSV file types. It is strongly recommended that you select Send command output one line at a time for CSV formatted files since data sent to the Arbitrator server will closely resemble the result of a SQL query.
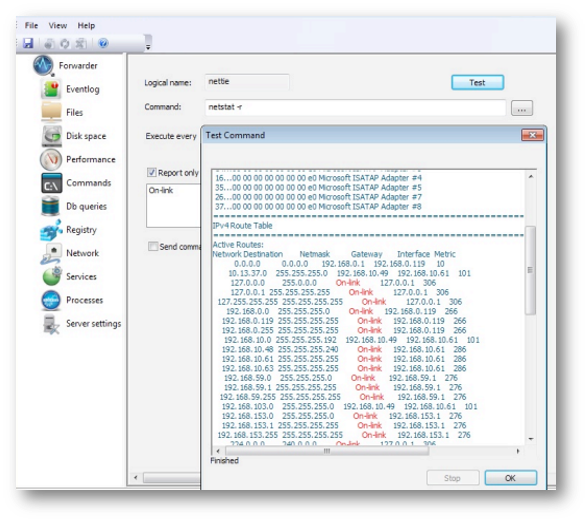
Each command must be tested before it is added to the configuration. To do this, click the Test button:
Database Queries
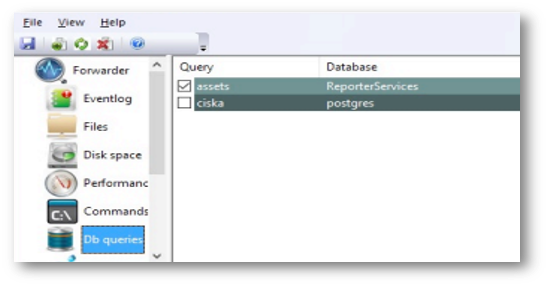
The Forwarder is able to run queries against any ODBC compliant database at defined intervals, and to stream the results of the query to the Arbitrator server.
To configure a query, the local system must have an ODBC driver installed and a system DSN configured. The Forwarder has been tested against multiple databases, including Microsoft SQL server, Postgres, and Intersystems Cache.
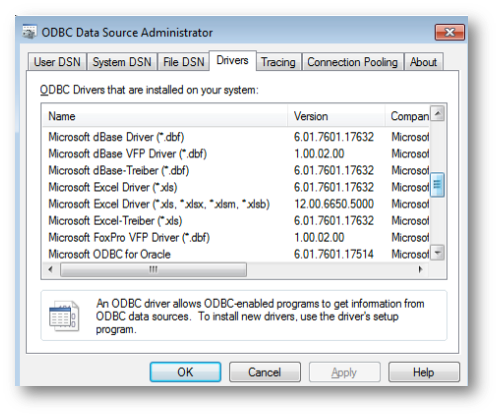
Since the Forwarder is a 32 bit application it will use 32 bit drivers and related DSN-s that can be checked by executing:
C:\Windows\SysWOW64\odbcad32.exe:
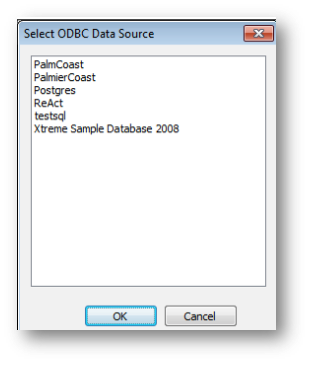
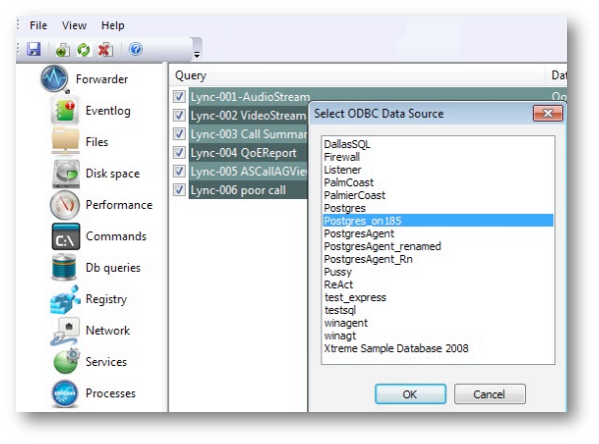
To configure a new query, select Add Query, which displays a list of all existing ODBC data sources:
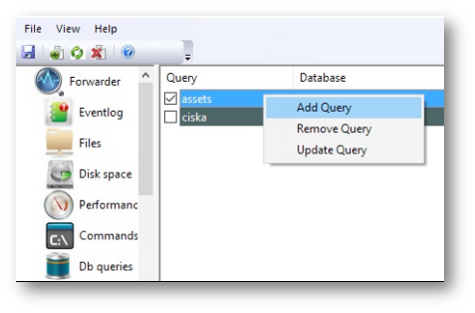
Choose a data source and click OK.
The system attempts to connect to the database to retrieve information about its tables and views that will be displayed on the following screen in the leftmost window.
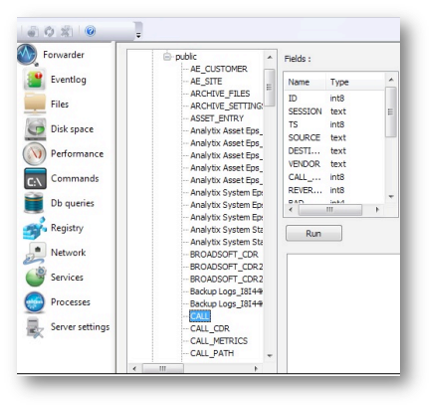
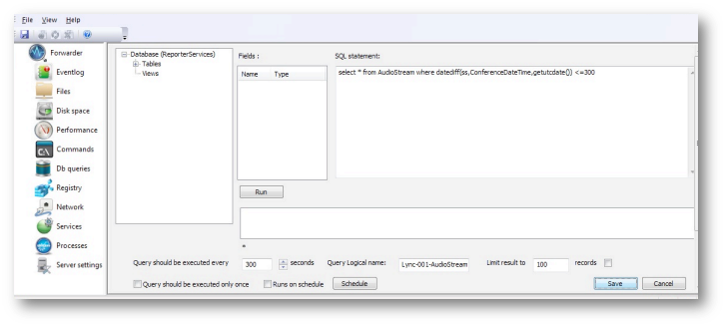
You can extend tables and views to see the database architecture. The tree structure will depend on the database layout and schemas (when applicable). Clicking on a table or view displays all the fields and their types:
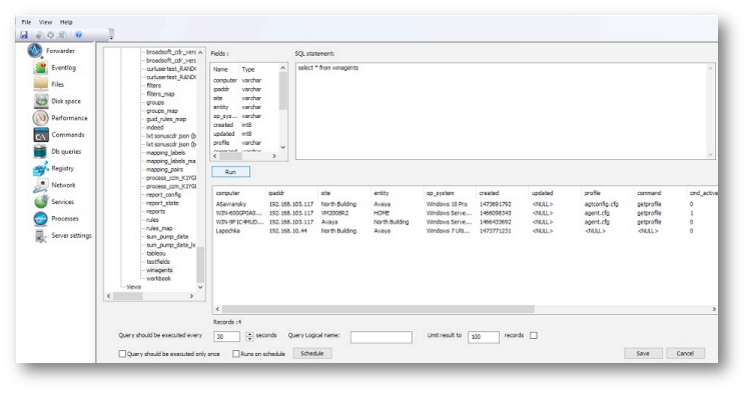
The SQL statement should be typed in the third window. Clicking Run triggers an execution of the statement and displays the result of the query.
There are three options for executing the SQL query:
every “xxx” seconds as defined on configuration screen above
only once (which may be used to import large amount of data)
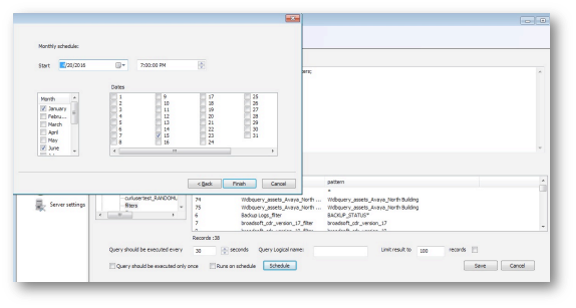
based on a schedule that can be configured by pressing the “Schedule” button
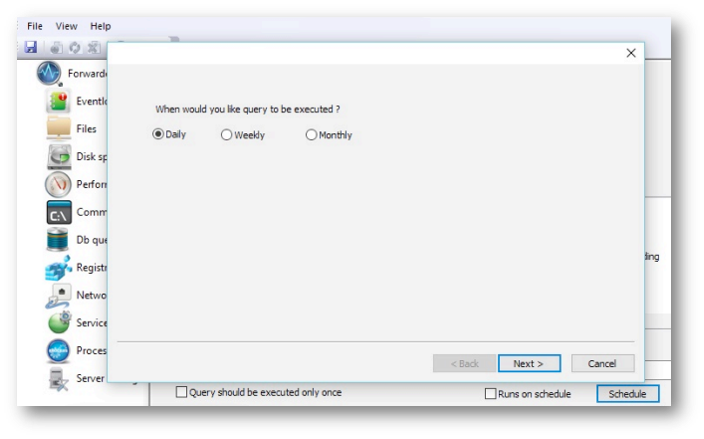
The first screen allows you to choose the schedule mode:
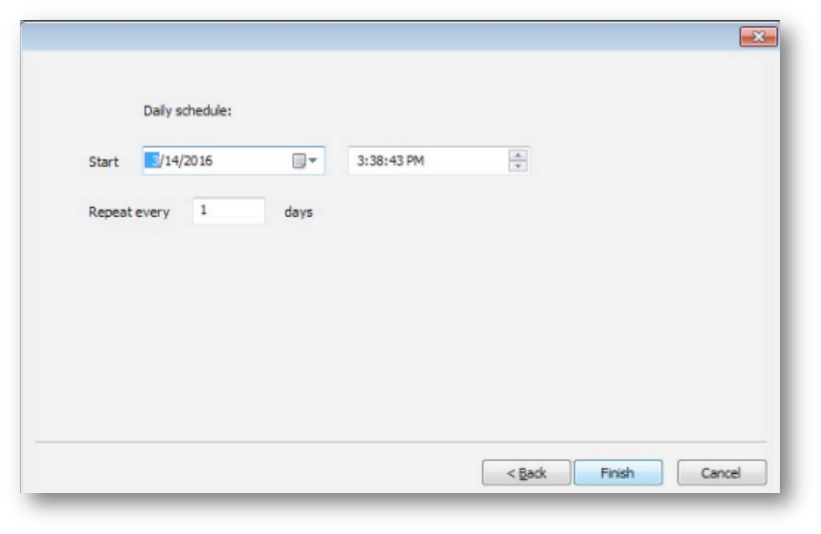
When using a daily schedule, the query is executed starting at the date and time selected, and repeated the same time every n days, based on the configuration:
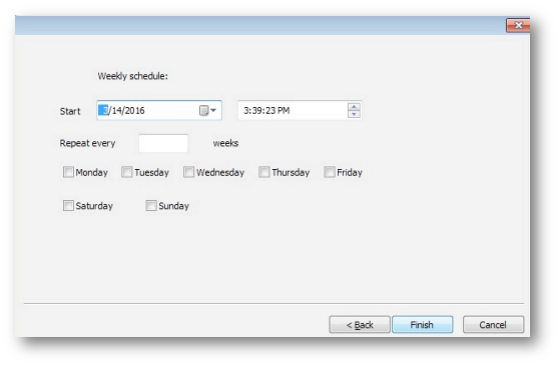
When using a weekly schedule, the query executes on the days of the week selected:
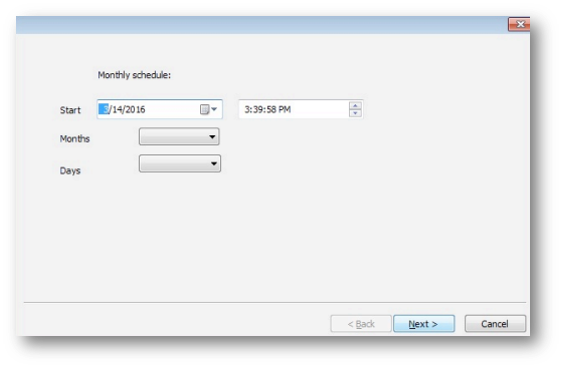
When using a monthly schedule, you can select months and dates of the month:
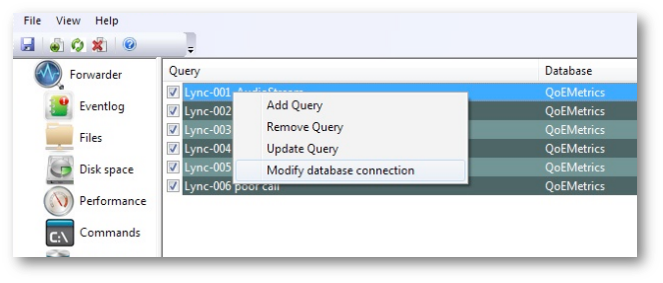
Modifying the query with a new database connection
You may need to modify the database connection for an existing query after importing the resulting data on a machine different from the one where the query was originally configured.
Since the database connection is embedded in the overall query information, a special mode was added to handle this situation:
Selecting Modify database connection displays a list of available DSN-s. These are presented in the same way as if the query is being created from scratch:
Once a DSN is selected, the application shifts to a single query view that combines SQL and scheduling data from previously existing query and new database connection:
When saving the modified query, a list of queries will now reflect the new database information:
Registry
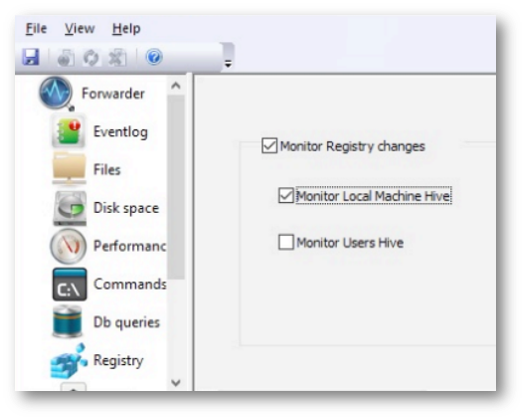
A separate service (which runs in tandem with the Forwarder), performs registry monitoring.
Registry monitoring can be enabled or disabled and you can specify what hives should be included.
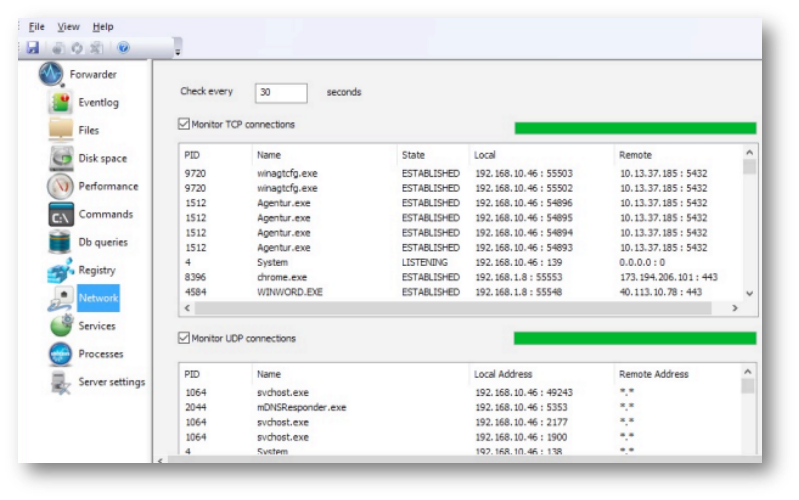
Network
The Forwarder can monitor all network connections providing the same information as the netstat command, including process information. Monitoring is performed based on the configuration and will include TCP and UDP connections depending on the options you select:
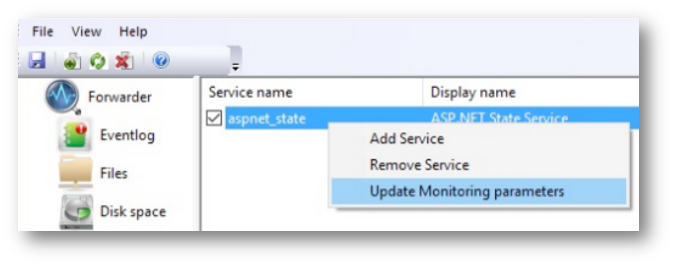
Windows Services
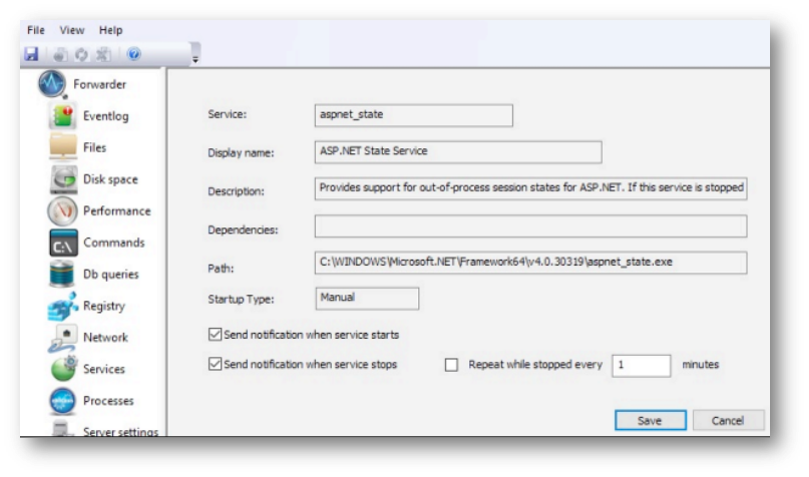
The Forwarder can monitor the status of any Windows service and report it to the Arbitrator server.
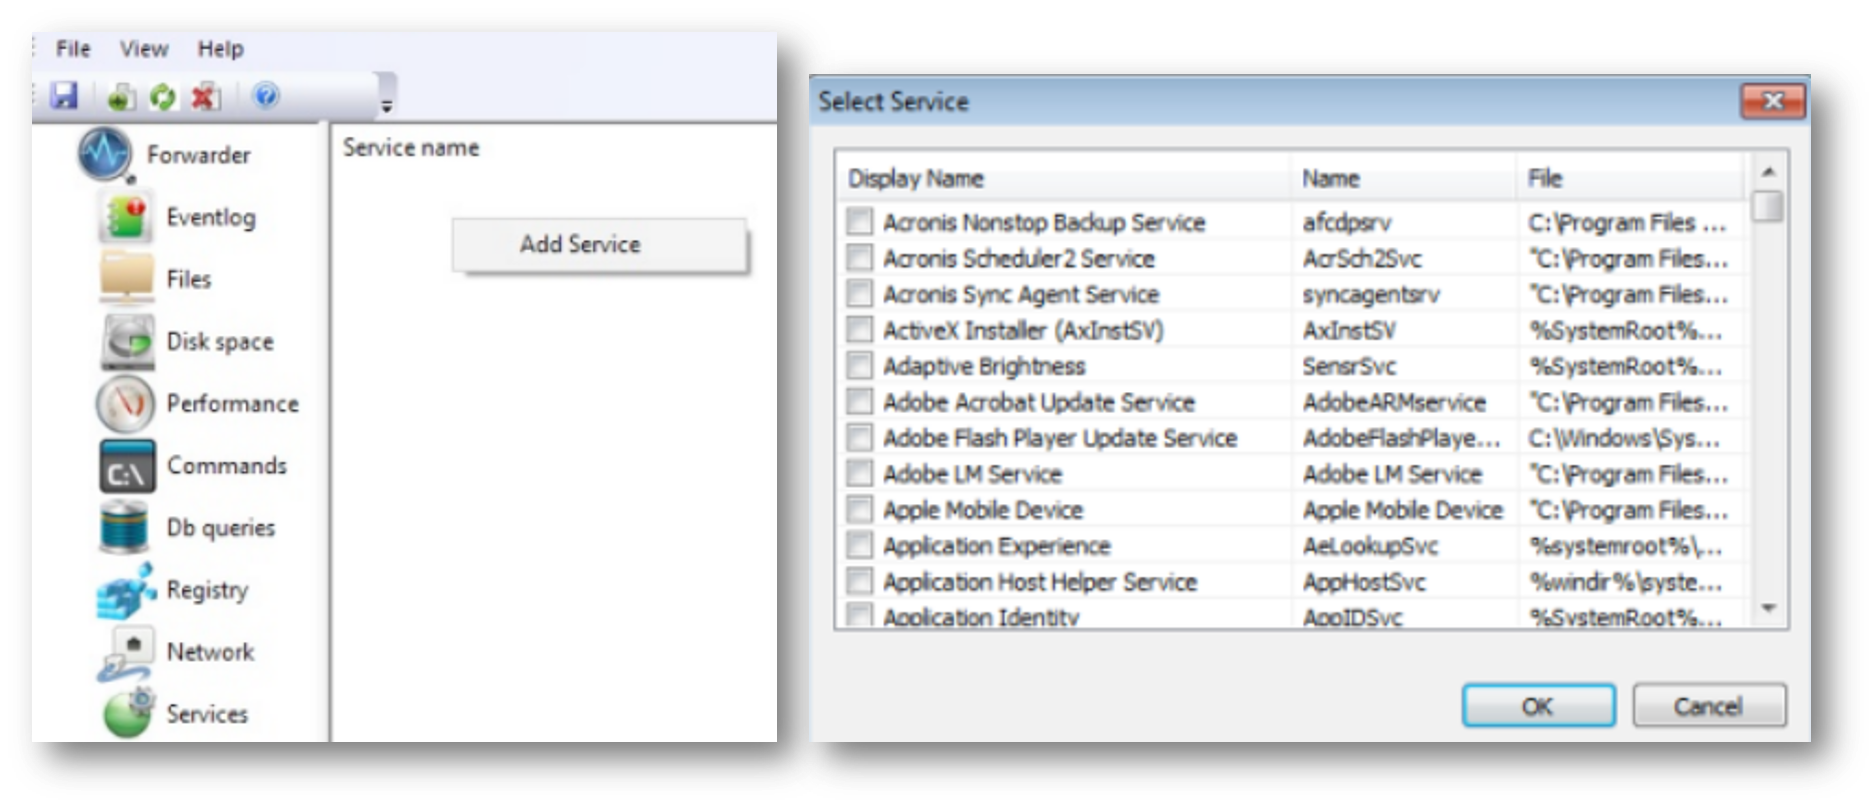
For each monitored service, you can specify the following options:
Forwarder Configuration
This page allows you to define connection information between the Forwarder and the local Arbitrator server.
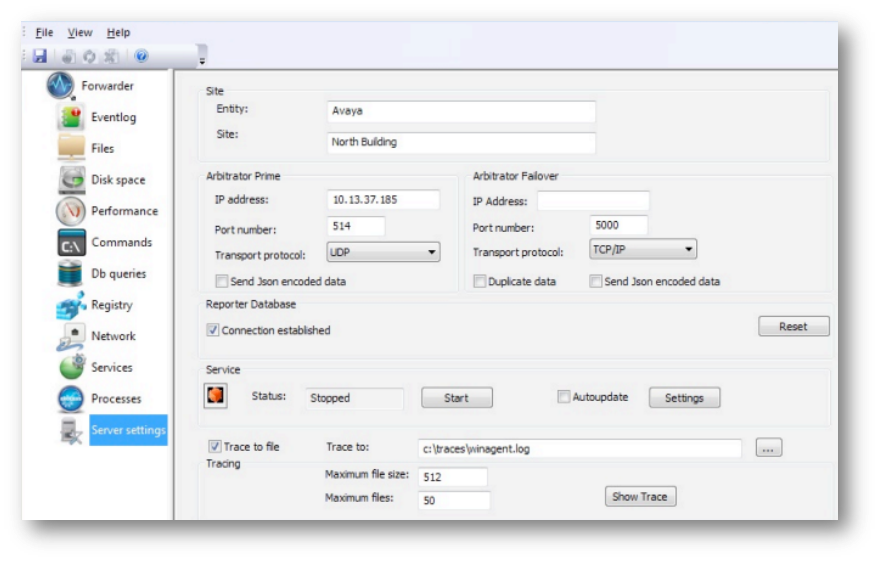
Although the configuration screen explicitly mentions Arbitrator (Correlation Server), the Forwarder can work with both the Arbitrator and Dashboard server. The ports will depend on which system the Forwarder will be connected to. In the case of Dashboard, it is preferable to send the data in JSON format.
The latest version of the Forwarder can save data directly into the Dashboard server database, if it is configured to communicate directly with the Dashboard server. Even though the configuration dialog mentions Arbitrator (Correlation Server), you can use the Dashboard IP address.
The Forwarder service will send a request to the server upon startup and upon receiving the type of the server, will change it’s behavior.
To be able to write data into the Dashboard/Reporting database, the Forwarder needs a locally configured system DSN pointing at the Dashboard/Reporting database. This DSN will be created by a configuration program when it’s first launched after the installation.
If the DSN has been configured and tested, a Connection established checkbox is selected,
and the service will be set to create several “static” tables that will hold performance,
eventlog, network, and process data. These tables are created by calling the REST APIs executed
by the Dashboard/Reporting server. Each of these tables will be named following the same pattern,
<data type>_<site>_<entity>, for example, evtlog_avaya_north building.
Tables collecting the results of database queries will be named: Wbquery\_
This screen also provides a way to configure traces of the Forwarder service.