VOSS Reference Dashboards
Overview
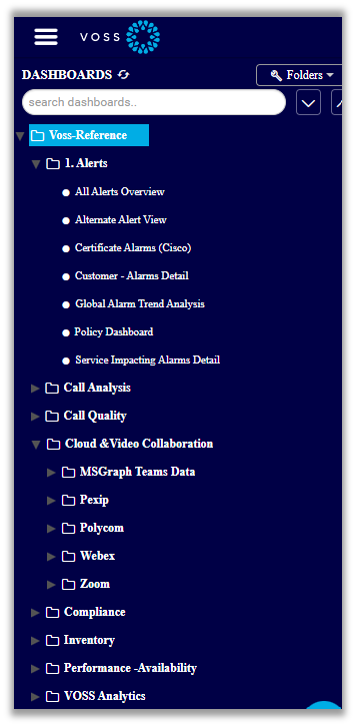
VOSS Insights Dashboard ships with a collection of standard, read-only, reference dashboards.
To access the reference dashboards, click the hamburger icon ![]() to open the Dashboards pane,
then expand the VOSS reference folder. The dashboards are organized in several sub-folders.
to open the Dashboards pane,
then expand the VOSS reference folder. The dashboards are organized in several sub-folders.
While you can’t edit, delete, or move the reference dashboards (or their folders), you can clone (copy) any of these dashboards, then modify the clone to create new, custom dashboards that meet your requirements.
Note
Dashboards are based on search definitions that extract data from one or more fields. These may be predefined search definitions that ship with the default dashboards, or definitions that you set up to create custom views of the data to meet the needs of your organization.
Important
The VOSS reference dashboards described in this topic is the standard set shipped with Insights v23.1. The VOSS reference dashboards collection may change at each software release. As at Insights 23.1, the following collections are included:
Related Topics
Alerts Dashboards
VOSS Insights provides the following reference dashboards for alerts:
All Alerts Overview
Alternate Alert View
Certificate Alarms (Cisco)
Customer Alarms details
Global Alarm Tiered Analysis
Policy Dashboard
Service Impacting Alarms Detail
Call Analysis Dashboards
VOSS Insights provides the following reference dashboards for call analysis:
Folder |
Reference Dashboards |
|---|---|
SBC |
|
SIP - E1 |
|
Note
Audiocodes dashboards display performance data collected via SNMP and the API from collection scripts and probes on the Arbitrator, providing support for SBC and Gateway, and allowing Audiocodes-specific alerting.
Call Quality Dashboards
VOSS Insights provides the following reference dashboards for call quality:
Call Performance and Voice Quality
CUCM Voice Quality Site Performance
Cloud & Video Collaboration Dashboards
VOSS Insights provides the following reference dashboards for cloud and video collaboration:
Folder |
Reference Dashboards |
|---|---|
MS Graph Teams Data |
|
Pexip |
|
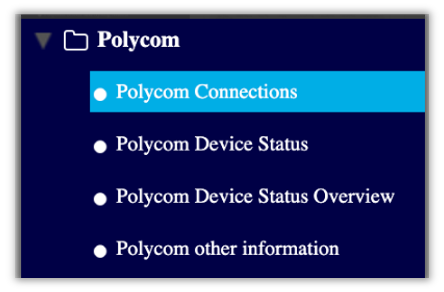
Polycom |
Reports on the health and status of Polycom meeting room devices for audio and video conferencing. For example, Polycom Device Status provides a system, software, and audio dashboard for Polycom devices.
|
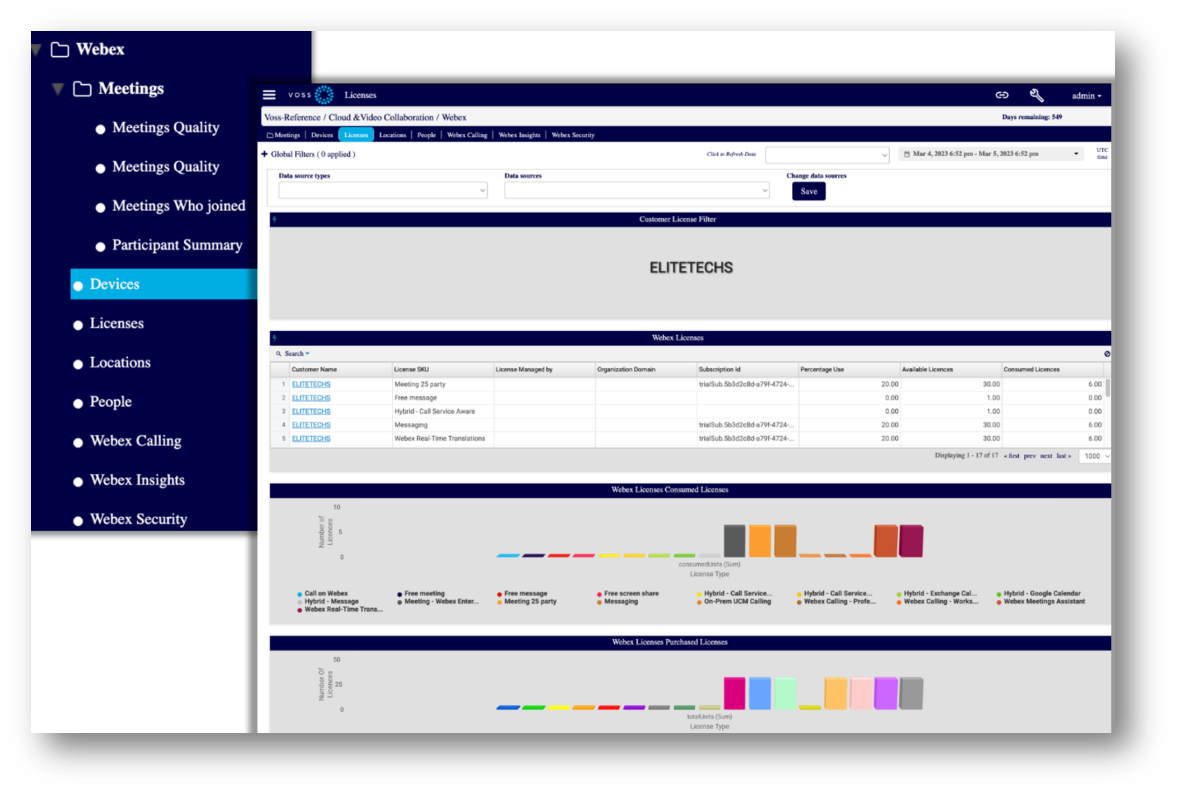
Webex |
Webex dashboards can be used if your Arbitrator is configured for Webex. |
Folder |
Reference Dashboards |
|---|---|
Zoom |
|
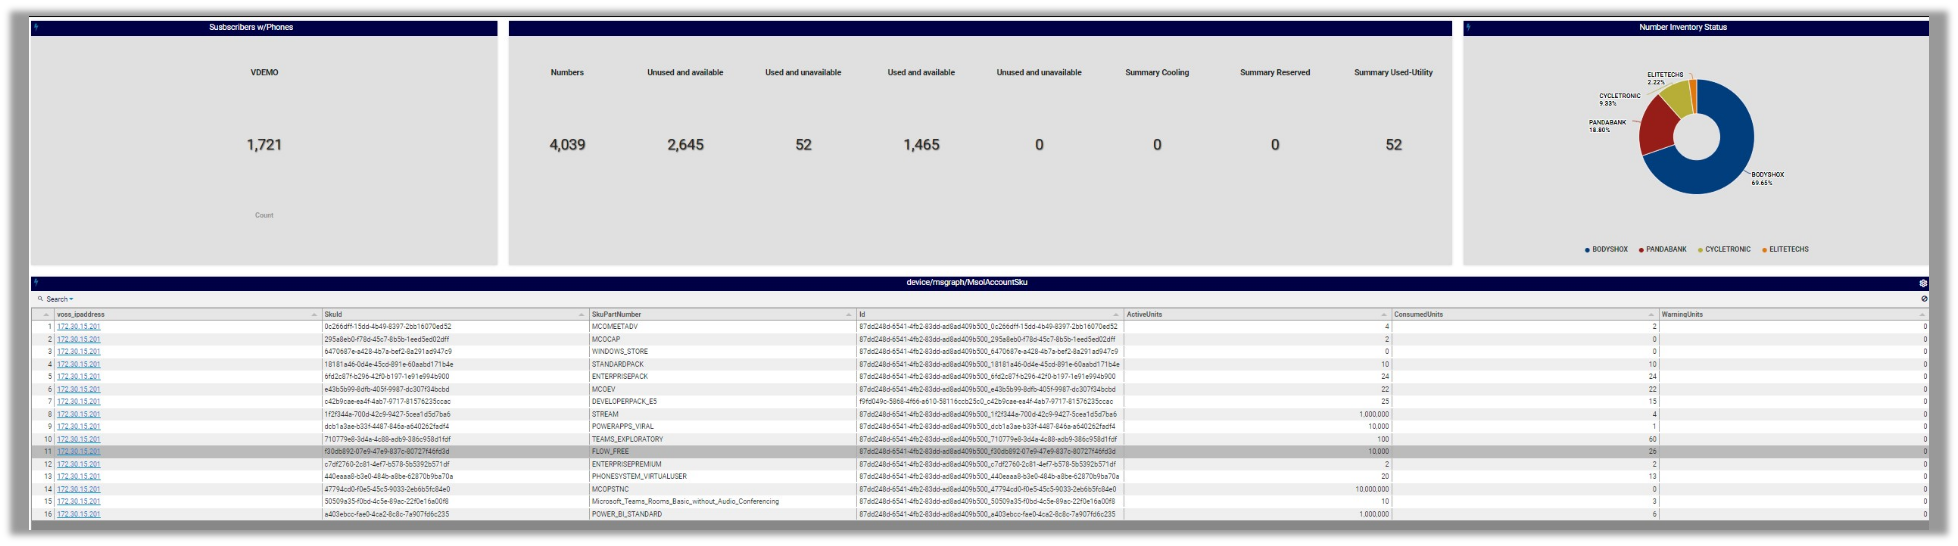
Using the MS Graph Teams Data Dashboards
VOSS reference dashboards for Microsoft Teams Calls/Teams Room use Graph API for monitoring. The dashboards display data as graphs and charts, and then displays the same data in tables (at the bottom of each dashboard), so that you can print the information in the tables, in an easily readable format.
Note
Before you can use the MS Graph Teams Data dashboards to collect and display Microsoft Teams data, you’ll need to configure the Microsoft tenant (on Microsoft); that is, to register the application and obtain a customer tenant ID, client secret, and client ID. You will need these details to input on the Arbitrator when enabling MS Teams monitoring (via Archive Management > Configuration Management > API Config > MS Teams Config). See the Configuration section in the Arbitrator Administration Guide for further details.
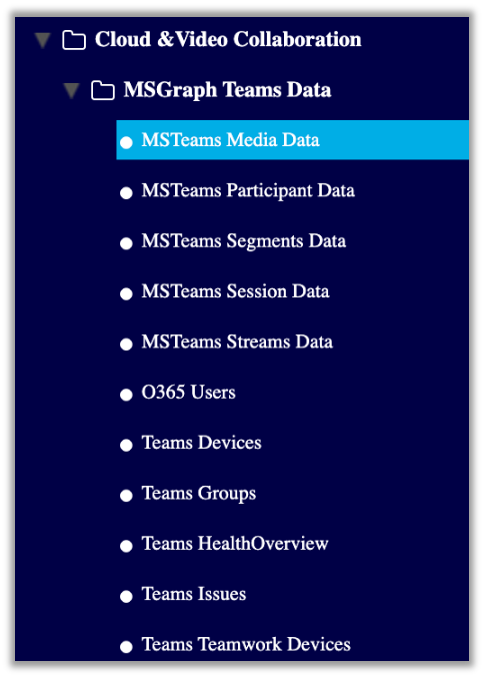
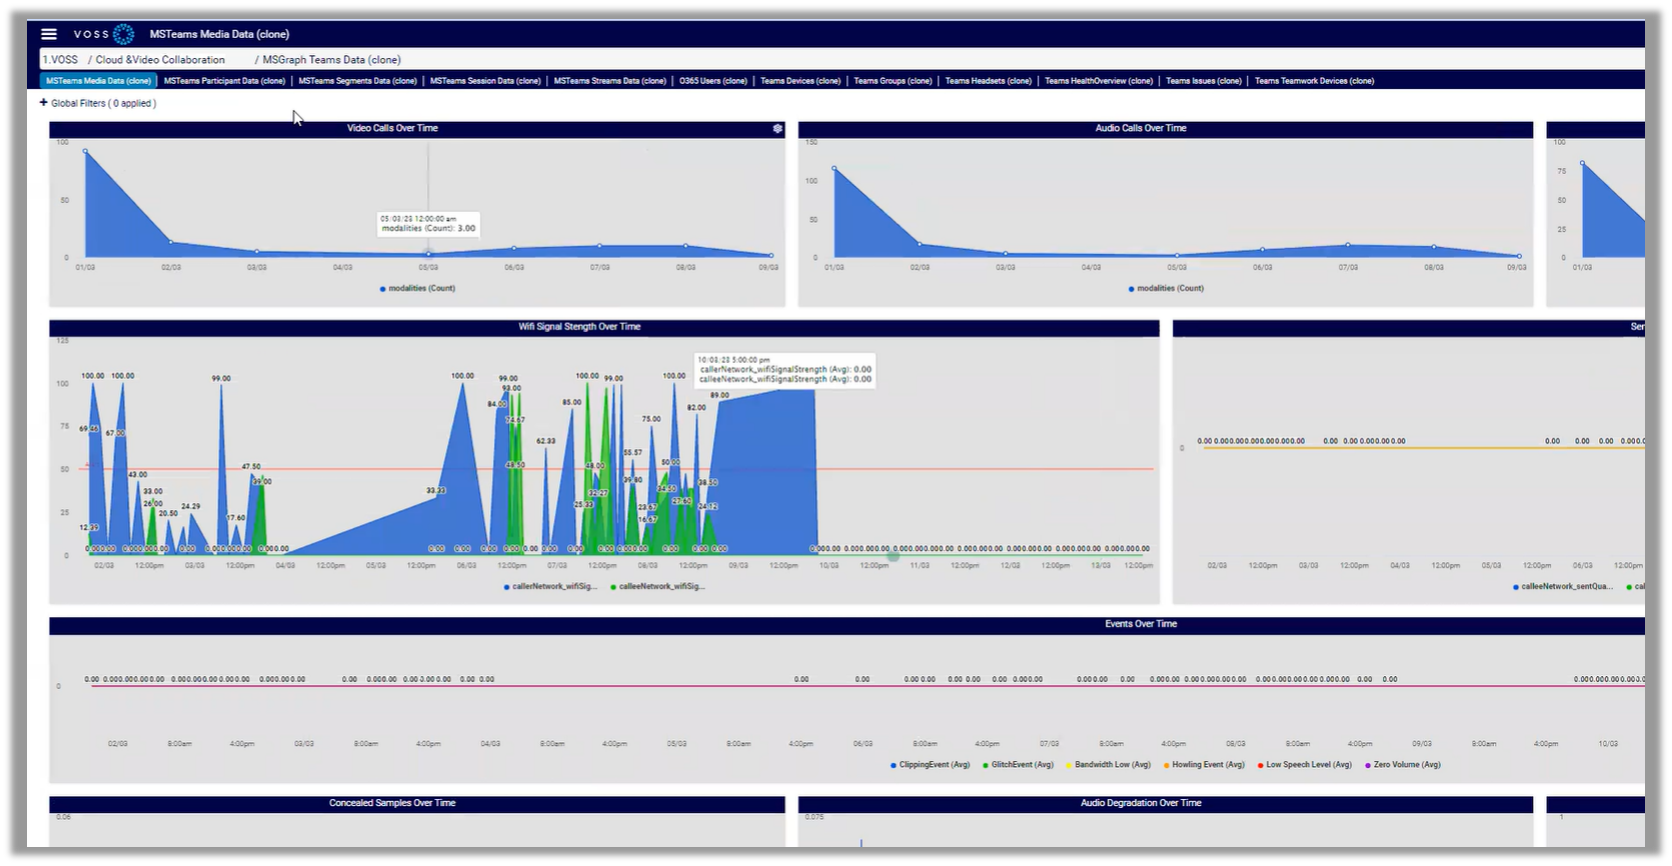
MSTeams Media Data Dashboard
This dashboard provides statistics on media for all calls, including:
Video calls over time
Audio calls over time
VBS calls over time
Wifi signal strength over time
Send/receive quality ratio over time
Events over time
Concealed samples over time
Audio degradation over time
Packet loss percentage over time
MSTeams Participant Data Dashboard
This dashboard collects and displays participant data, for example, top participants, and the number of calls per participant.
MSTeams Segments Data Dashboard
This dashboard collects and displays detailed call data (for caller and callee), and whether calls are internal or outside of the tenant you have set up.
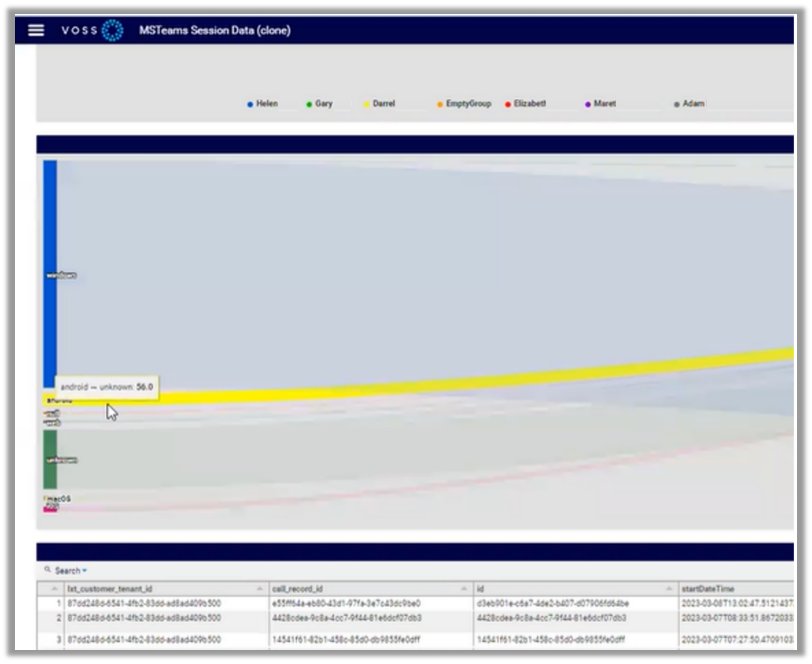
MSTeams Session Data Dashboard
This dashboard collects and displays session data, such as top ten callers, top ten called, user agents (the platform used, such as Windows or Android),
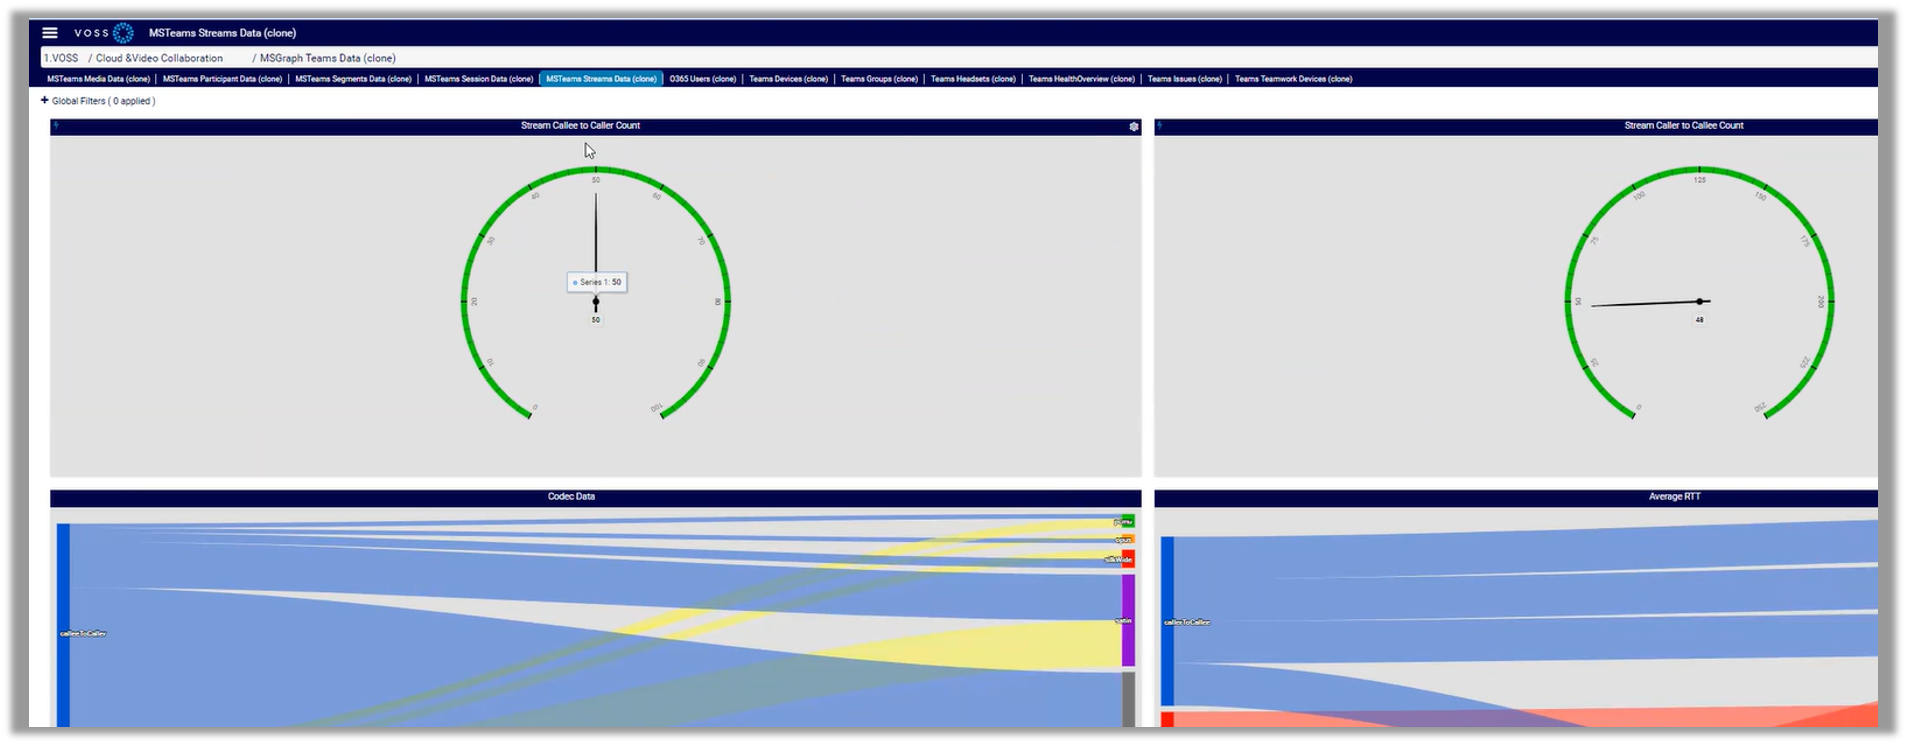
MSTeams Streams Data Dashboard
This dashboard collects and displays data such as the number of call streams that have gone out, caller to caller count, the codecs used, and round trip times (RTT).
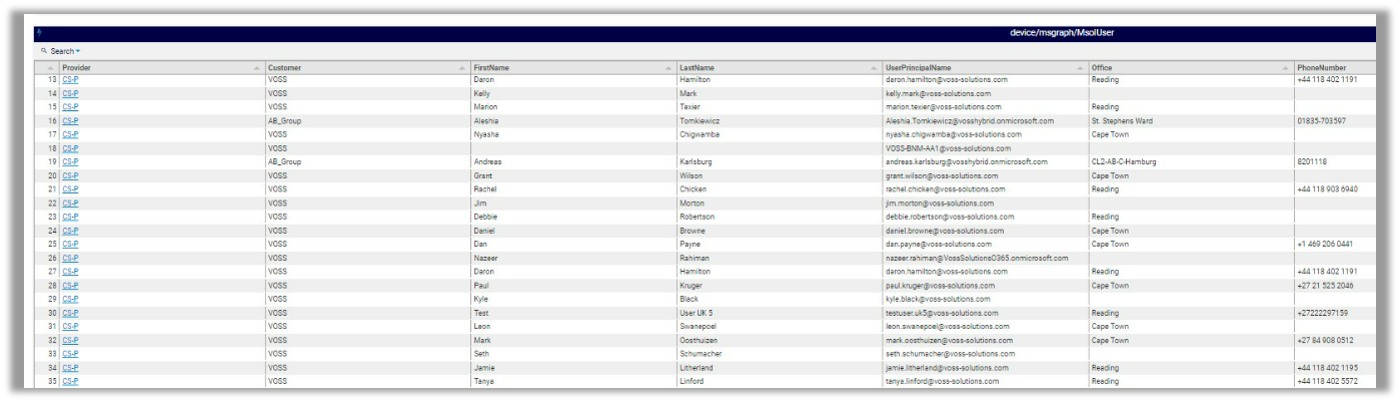
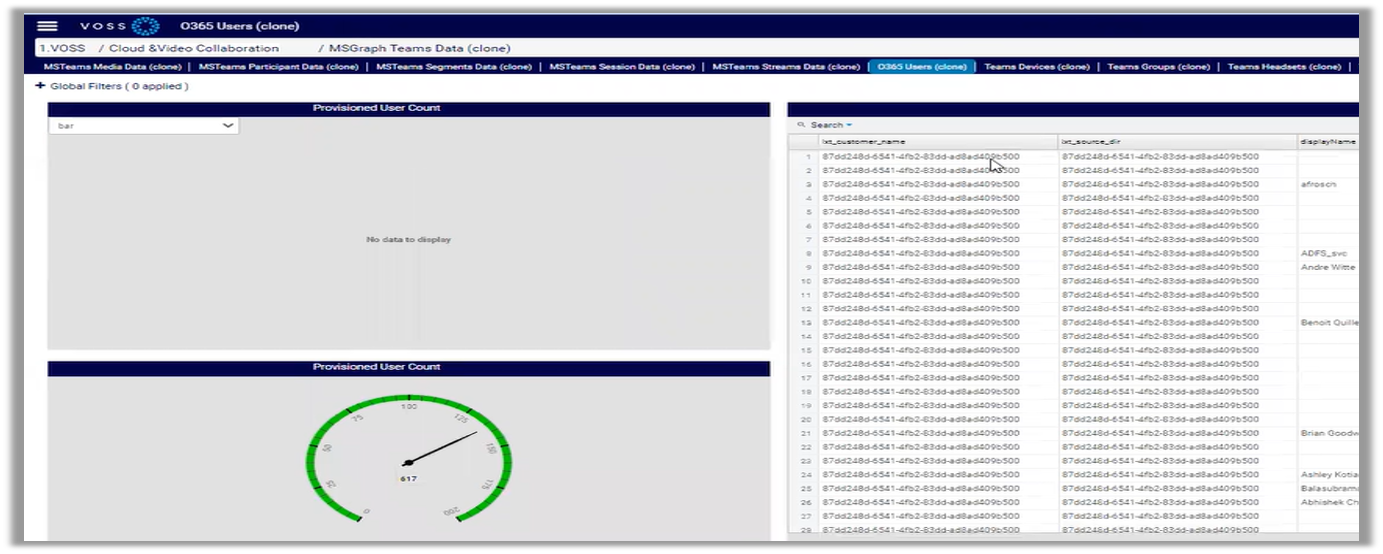
0365 Users Dashboard
This dashboard displays details for your 0365 users, including the number of 0365 users you have, their provisioning and other details.
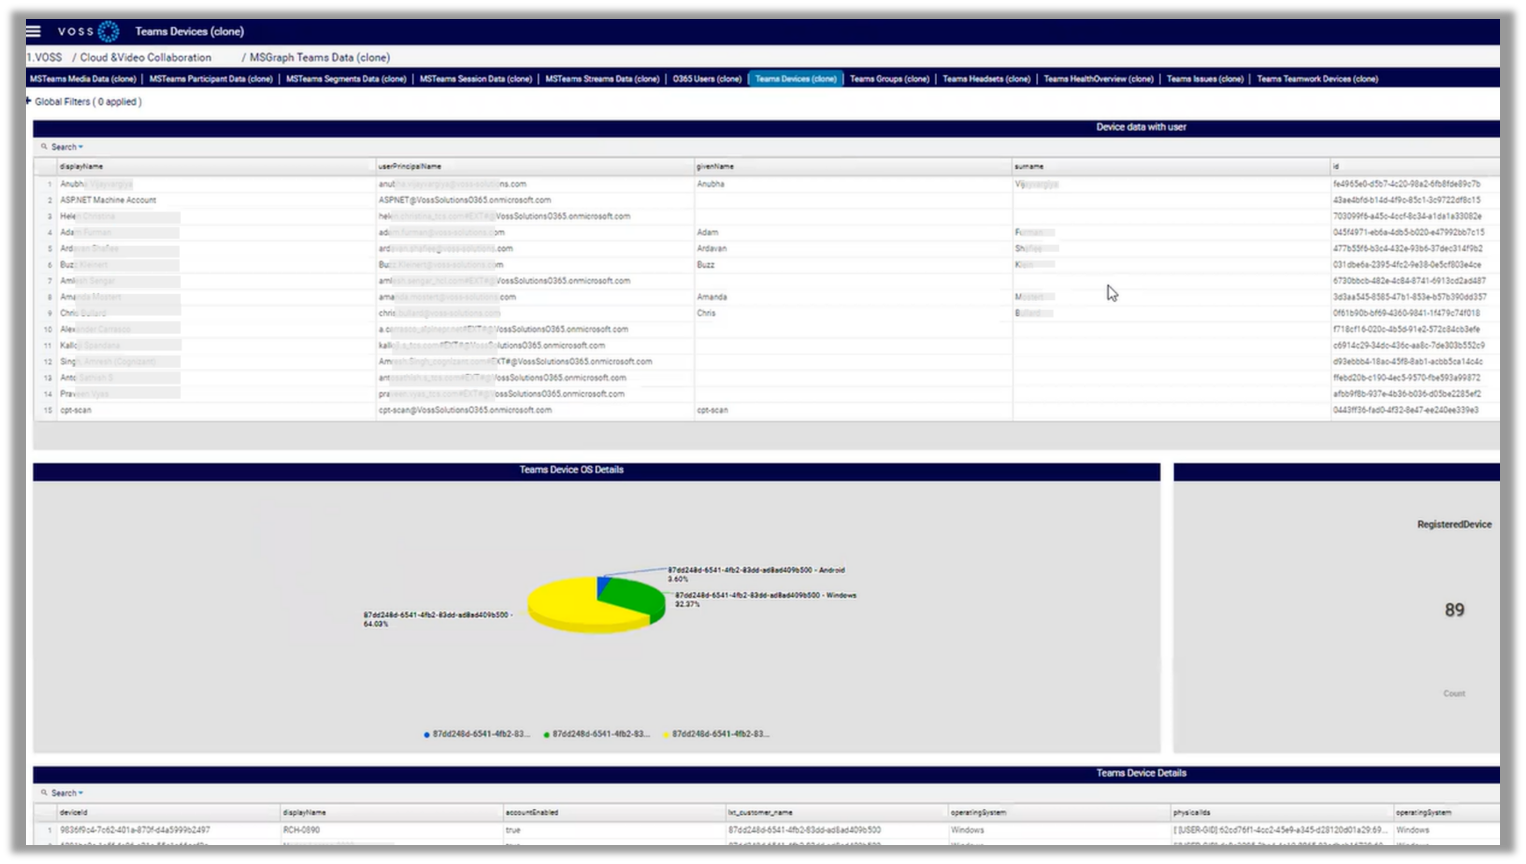
Teams Devices Dashboard
This dashboard provides details for the devices deployed in your environment, including devices per user, operating systems, and registration details.
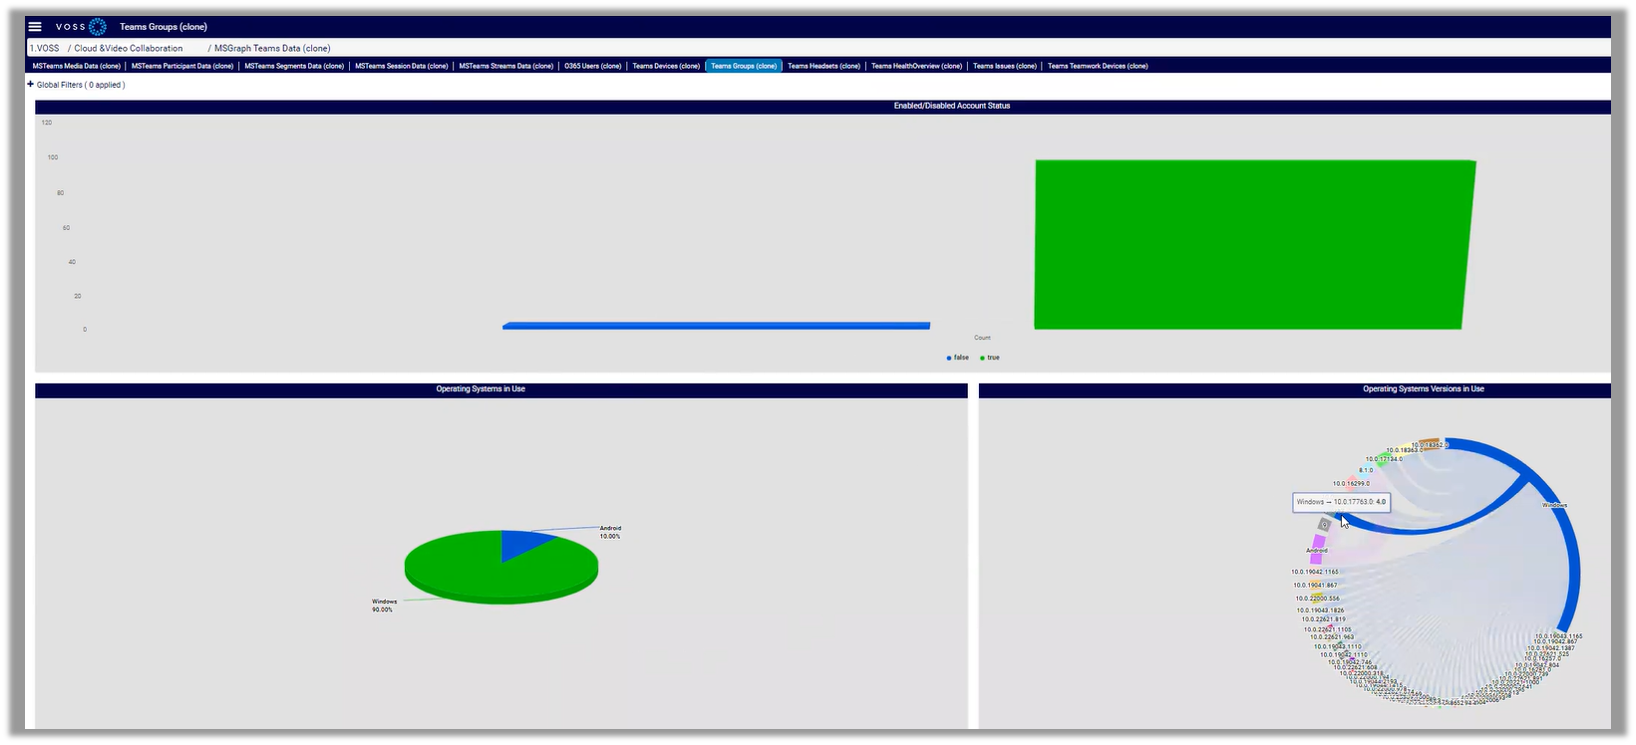
Teams Groups Dashboard
This dashboard collects data about enabled and disabled users, operating systems in use and their versions.
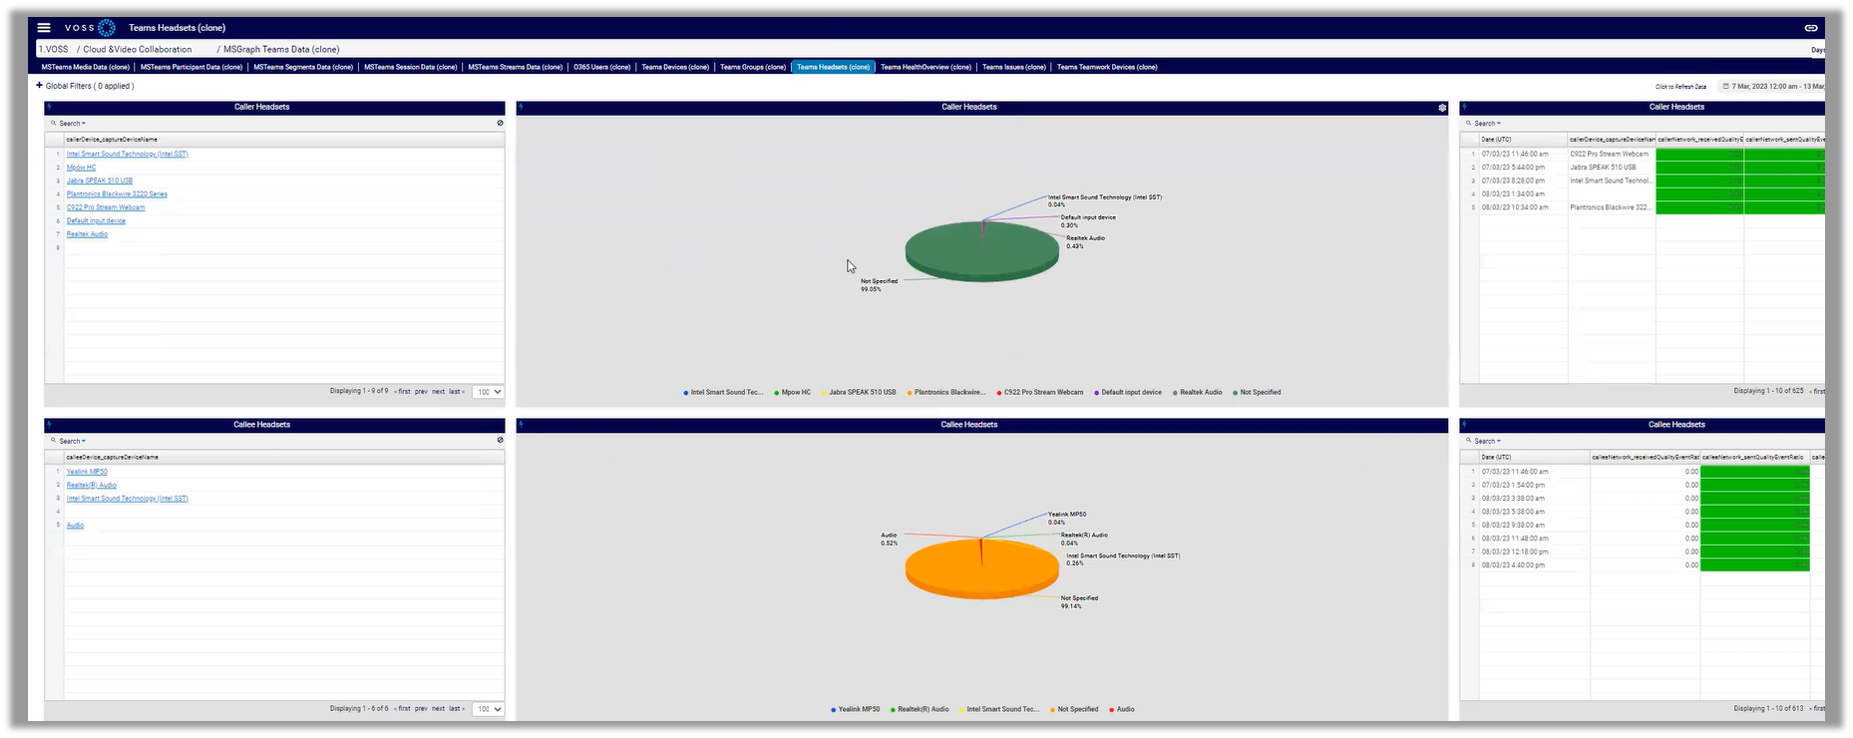
Teams Headsets Dashboard
This dashboard collects and displays data about the headsets in use, including device name and type, by caller and callee. You can click on a device to view further details, such as whether any issues are detected on the device.
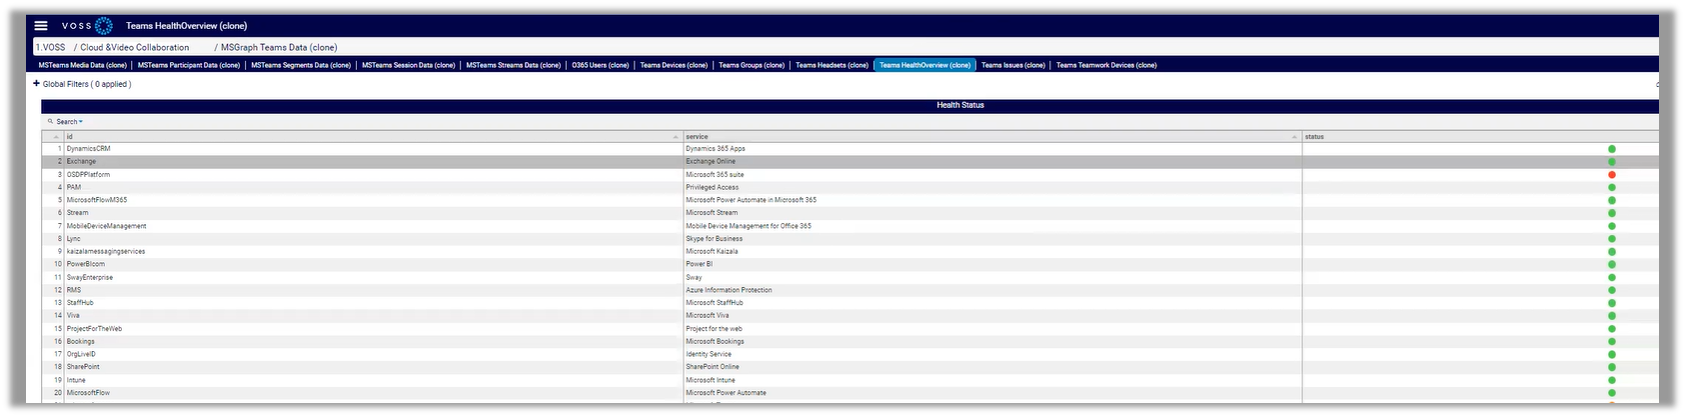
Teams Health Overview Dashboard
This dashboard collects hourly data from Microsoft to report on the health of apps and data on the remote Microsoft site, for example, service degradation is reported.
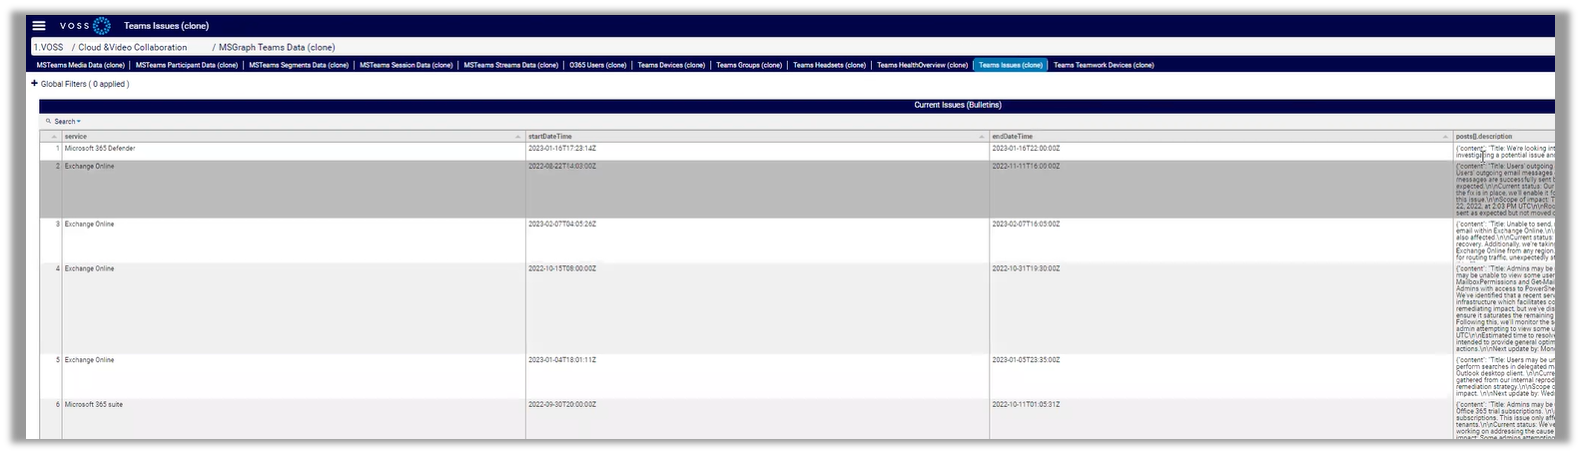
Teams Issues Dashboard
This dashboard detailed historical data for any teams issues.
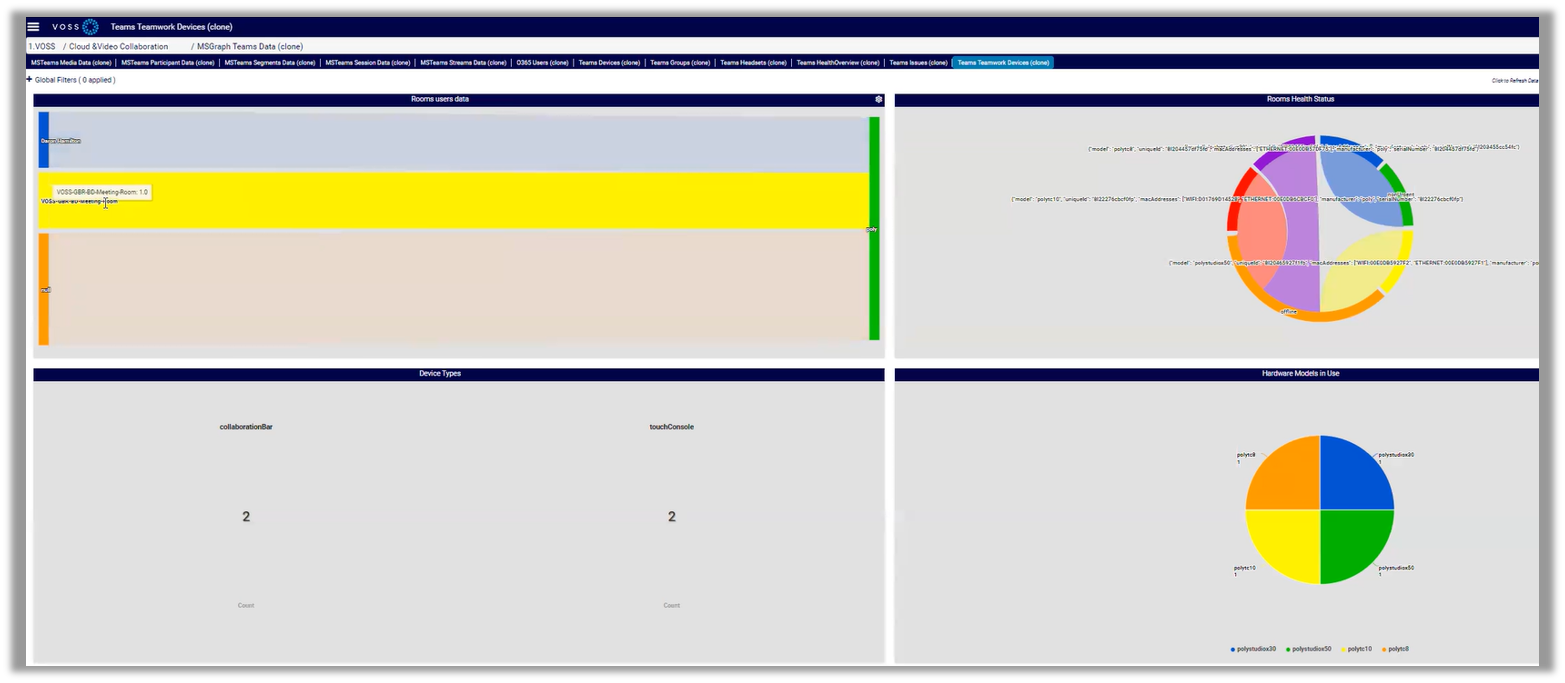
Teams Teamwork Devices Dashboard
This dashboard displays MS Teams Rooms data, including configured rooms, software health status and activity status, type of Teams devices, and hardware models in use.
Compliance Dashboards
VOSS Insights provides the following reference dashboards for compliance:
Cisco CUC Voicemail
Cisco CUCM Compliance
Cisco CUCM Health Check
Cisco Smart License clone
Using the Cisco Smart License Dashboard
The Cisco Smart License dashboard is a VOSS reference dashboard that you can clone to create a new, custom dashboard for monitoring reports to support license management for Cisco Smart Licensing. For example, to view details for license types and products, to monitor license status and usage over time, and to manage capacity and license costs.
To set up and use this dashboard:
In Arbitrator, add and configure the following probe for Cisco Smart License:
getCiscoSmartLicense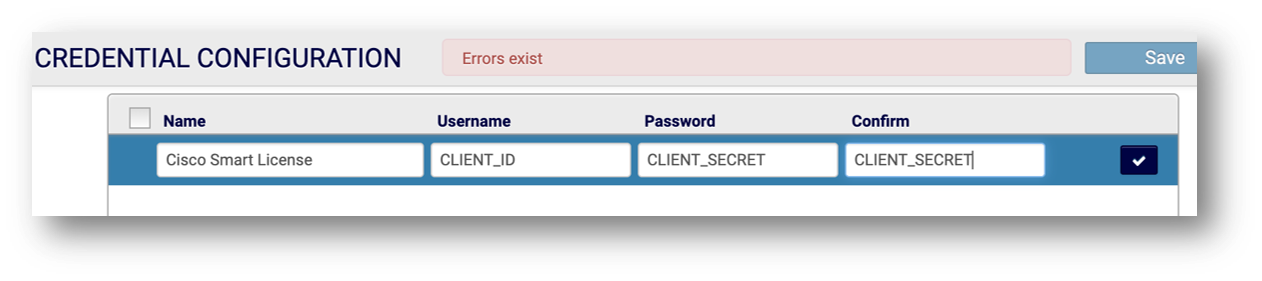
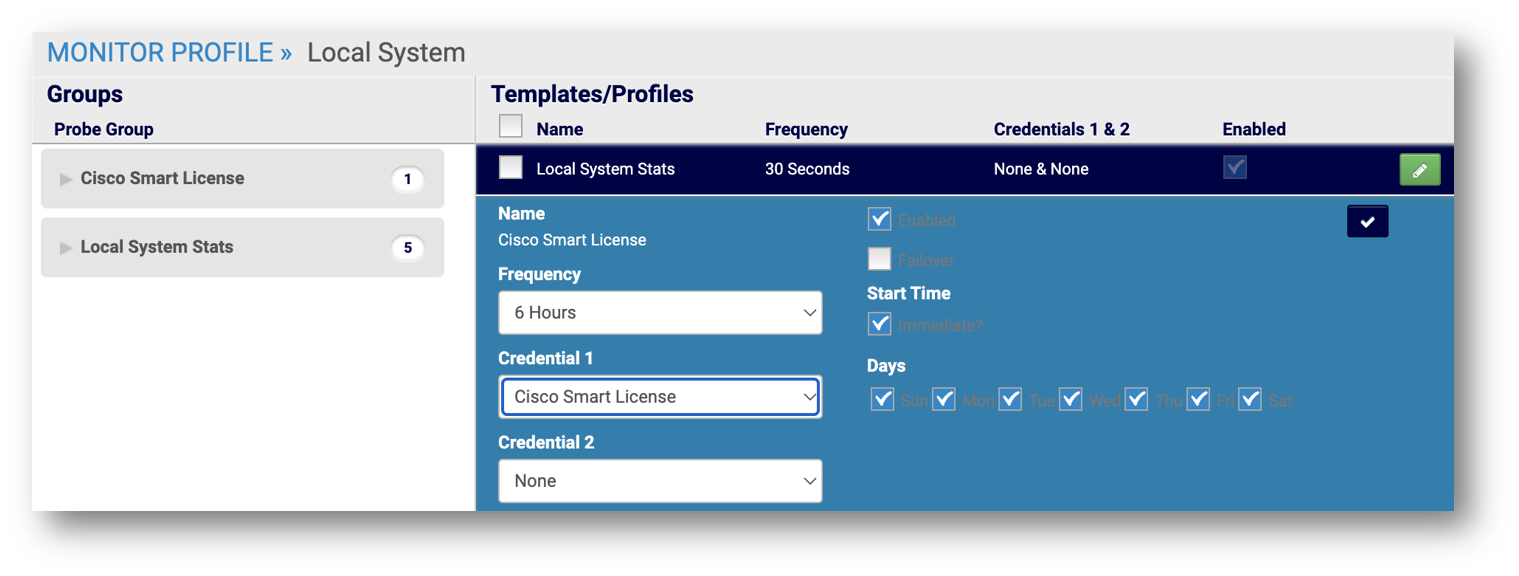
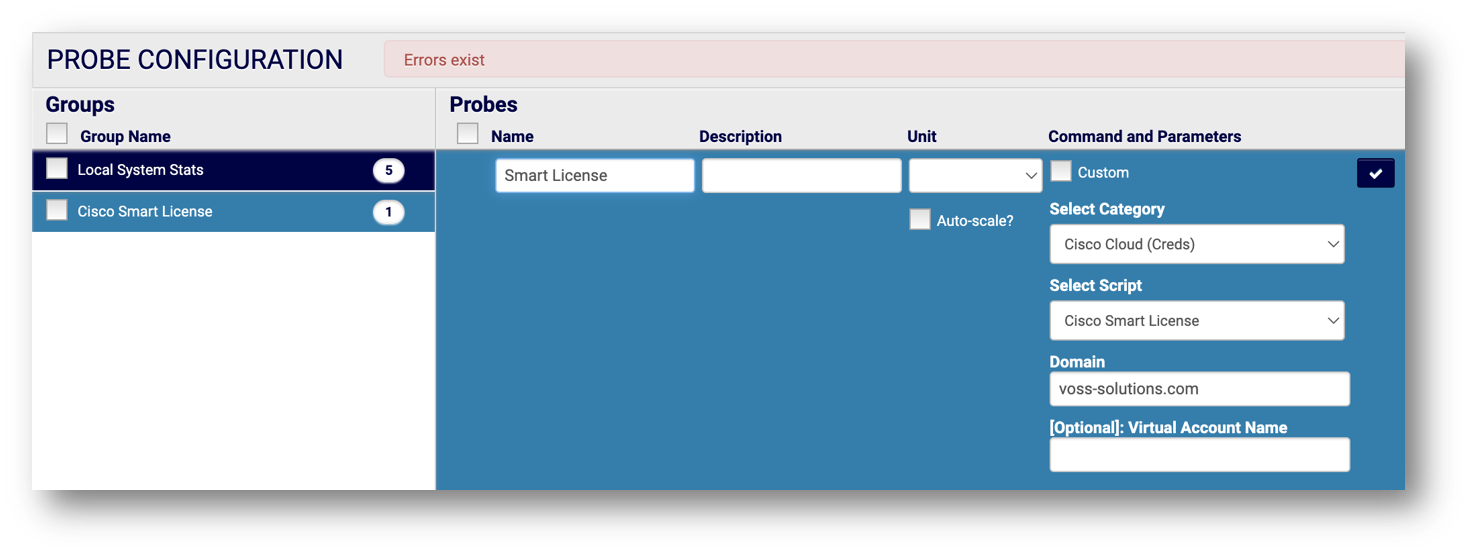
In Arbitrator, attach the probe to the relevant asset.
Note
The getCiscoSmartLicense probe for this dashboard ships with VOSS Insights. Once configured and assigned to the device you wish to monitor, the probe gathers Cisco Smart License data via Cisco Cloud Smart License API. You can view the data via the Cisco Smart License dashboard.
In VOSS Insights Dashboard, in the Dashboards panel, select the custom dashboard you created (based on the VOSS reference Compliance dashboard for Cisco Smart License).
View data in the dashboard, which provides further options for configuring filters and time periods for the data you wish to view.
Using the Cisco CUCM Health Check Dashboard
You can create a clone of the VOSS reference compliance dashboard, Cisco CUCM Health Check, for reporting on the following data:
Software versions
DHCP
DNS
NTP status
SSH status
Telnet status
Web GUI timeout
CUCM Diag status
DB replication
To set up and use this dashboard:
In Insights Arbitrator, configure the following probes to gather status data from Cisco UCM (CUCM):
Probe
Commands to run to gather data
getCiscoCucmConfigshow statusshow network eth0show webapp session timeoututils ntp status
ciscoCucmServiceStatusutils service list
ciscoCucmDiagTestutils diagnose test
ciscoCucmDbReputils dbreplication runtimestate
ciscoCucmDisasterRecoverHistoryutils disaster_recovery history backup
In VOSS Insights Dashboard, select your custom dashboard (based on the VOSS reference dashboard, Cisco UCM Health Check), and view data.
The dashboard screen provides further options for configuring filters and time periods for the data you wish to view, based on these predefined definitions:
arbitrator_cisco_cucm_config
arbitrator_cisco_cucm_diagtest
arbitrator_cisco_cucm_dbrep
arbitrator_cisco_cucm_services
arbitrator_cisco_cucm_disaster_recovery_history
You can run the following reports based on the dashboard data:
Pub/Sub/TFTP uptime
Diagnostic tests
NTP Status
Replication
Service status
Backup and disaster recovery
Platform availability
Inventory Dashboards
VOSS Insights provides the following reference dashboards for inventory:
Cisco Headset Summary
Device Inventory Dashboard
Phone Inventory
Gateways
Performance - Availability Dashboards
VOSS Insights provides the following reference dashboards for performance (availability):
Folder |
Reference Dashboards |
|---|---|
Availability |
|
Cisco |
Use the Cisco Performance dashboards to view data on performance-related statistics for Cisco devices:
|
Insights |
|
UCCE |
Cisco UCCE dashboards allow you to view monitoring reports for a Cisco UCCE deployment. |
Vmware |
|
Windows |
|
Note
VOSS reference dashboards for Insights DS9 are available if a VOSS Insights DS9 server is installed.
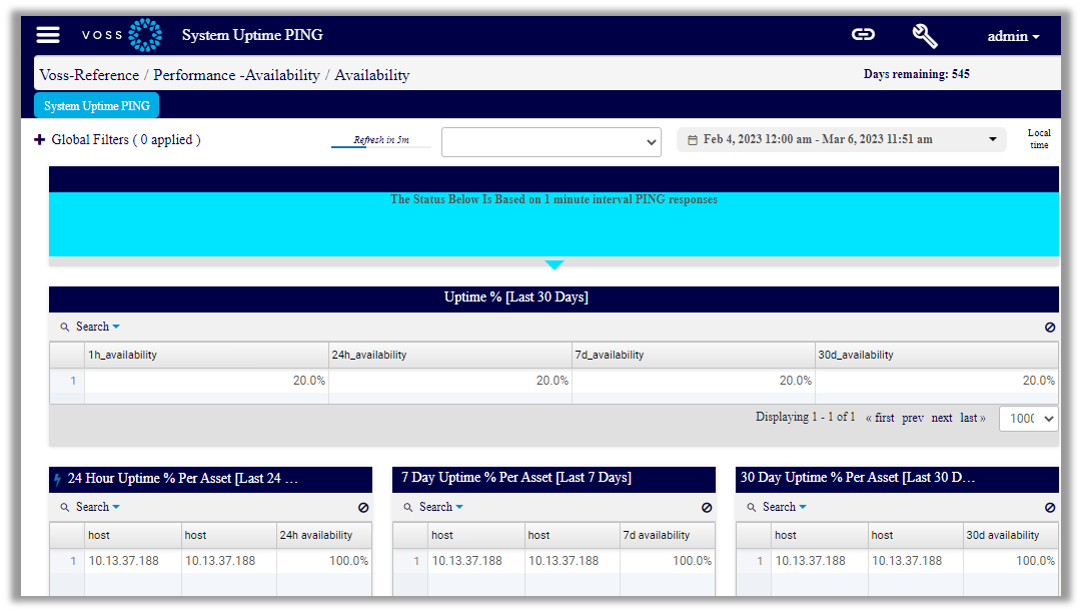
Using the System Uptime PING Dashboard
The VOSS reference dashboard System Uptime PING is a read-only dashboard that allows you to to view and monitor system-level availability data. System Uptime PING displays live statistics for predefined parameters, such as lxt_connect_time and lxt_total_time, displayed as dashboard widgets, for a selected Arbitrator.
Note
To modify this dashboard you’ll need to copy it and save it as a new, custom dashboard.
To set up and use this dashboard:
In Dashboard, clone and save a custom dashboard from the VOSS reference dashboard, System Uptime PING.
In Arbitrator, add and configure the PING probe.
In Arbitrator, attach the PING probe to the relevant assets (one or more).
Note
The PING probe ships with VOSS Insights. Once configured and assigned to each device that you wish to monitor, the PING probe stores historical availability results to the database.
In VOSS Insights Dashboard, point to an Arbitrator to view data:
In the DASHBOARDS panel, select your custom System Uptime PING dashboard (the one you created, based on the VOSS reference System Uptime PING dashboard).
Display the Data source types and Data sources fields (if hidden). To do this:
Click the toolbar Wrench icon, then select Hide/Show to display the Hide Show Options dialog.
Select Show Data source selector, and click Save.
Choose an option:
To view data for a particular widget, click the cog icon on the widget, then select Edit Widget to open the Configure Data dialog. In the Resource drop-down, choose the widget that defines the data you want to view in the dashboard, for example, Day_availability_ping), then choose a data source (the relevant Arbitrator), and click Save.
The dashboard displays data relevant to the widget and the selected data source.
To view data for all widgets (global view), for a selected Arbitrator, choose Data source type
Remote Arbitrator Postgre(global option), then from the Data Source drop-down, choose an Arbitrator.Note
This option provides a live refresh of data for all widgets, for a selected Arbitrator.
To save this global data view, click Save. Alternatively, the page loads data in the widgets, and you can choose another Arbitrator in the Data Source drop-down to load data for the next Arbitrator for which you want to view data.
The page loads fresh data each time you change the value in the Data Source drop-down. Displayed data depends on data available from the Arbitrator for which you’re running the query.
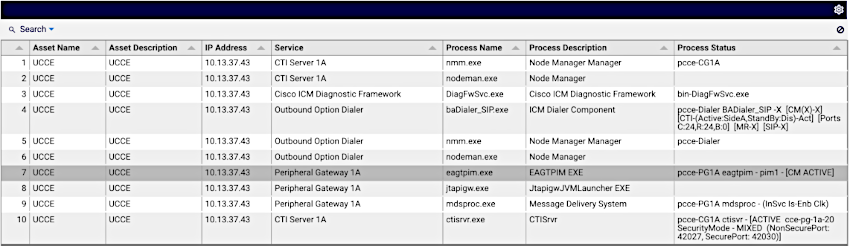
Cisco UCCE Dashboard with ListProcesses
This dashboard provides monitoring reports for a UCCE deployment, including such ListProcess details as Process Description, Process Status and Process UpTime and Service.
To set up and use this dashboard:
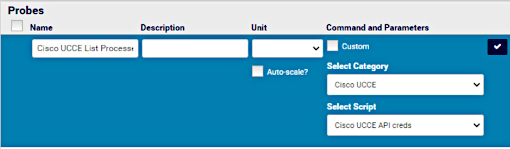
In Arbitrator:
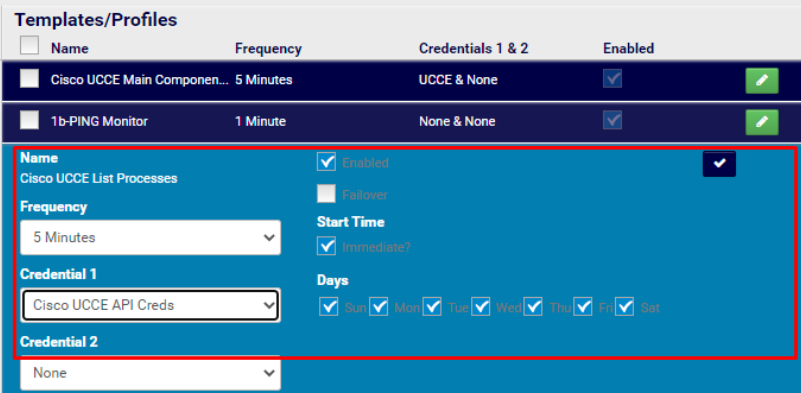
Add the probe group, e.g.: Cisco UCCE List Processes.
Add the probe with settings as below:
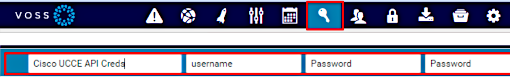
Create the credentials:
Go to Assets and assign the probe to a device:
In VOSS Insights Dashboard:
Use the resource Arbitrator_cisco_ucce_processes dashboard to view data.
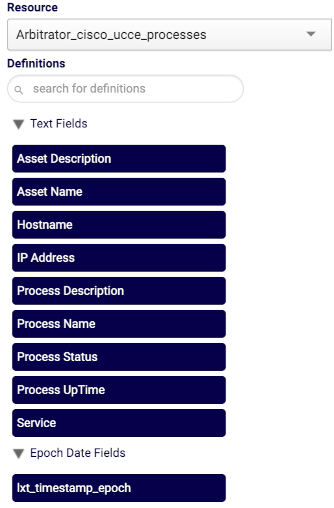
The dashboard screen provides further options for configuring filters and time periods for the data you wish to view.
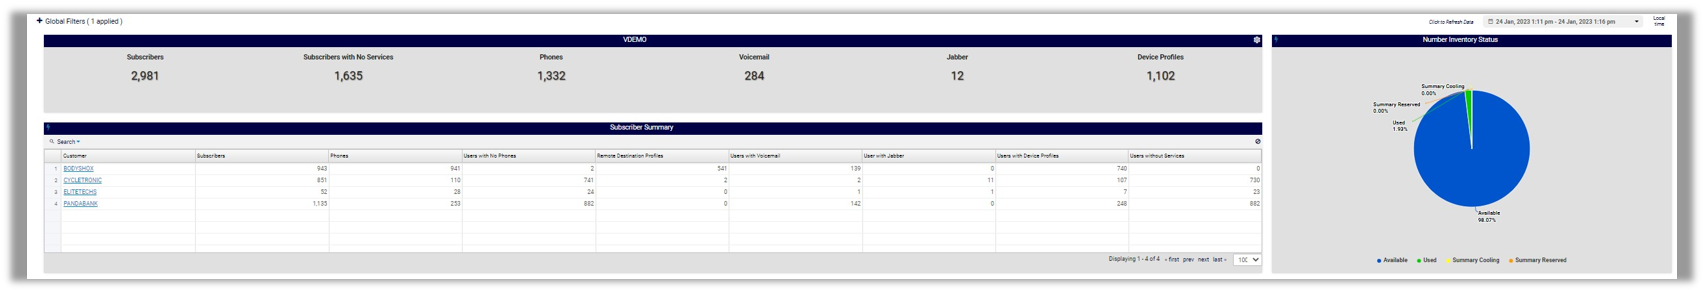
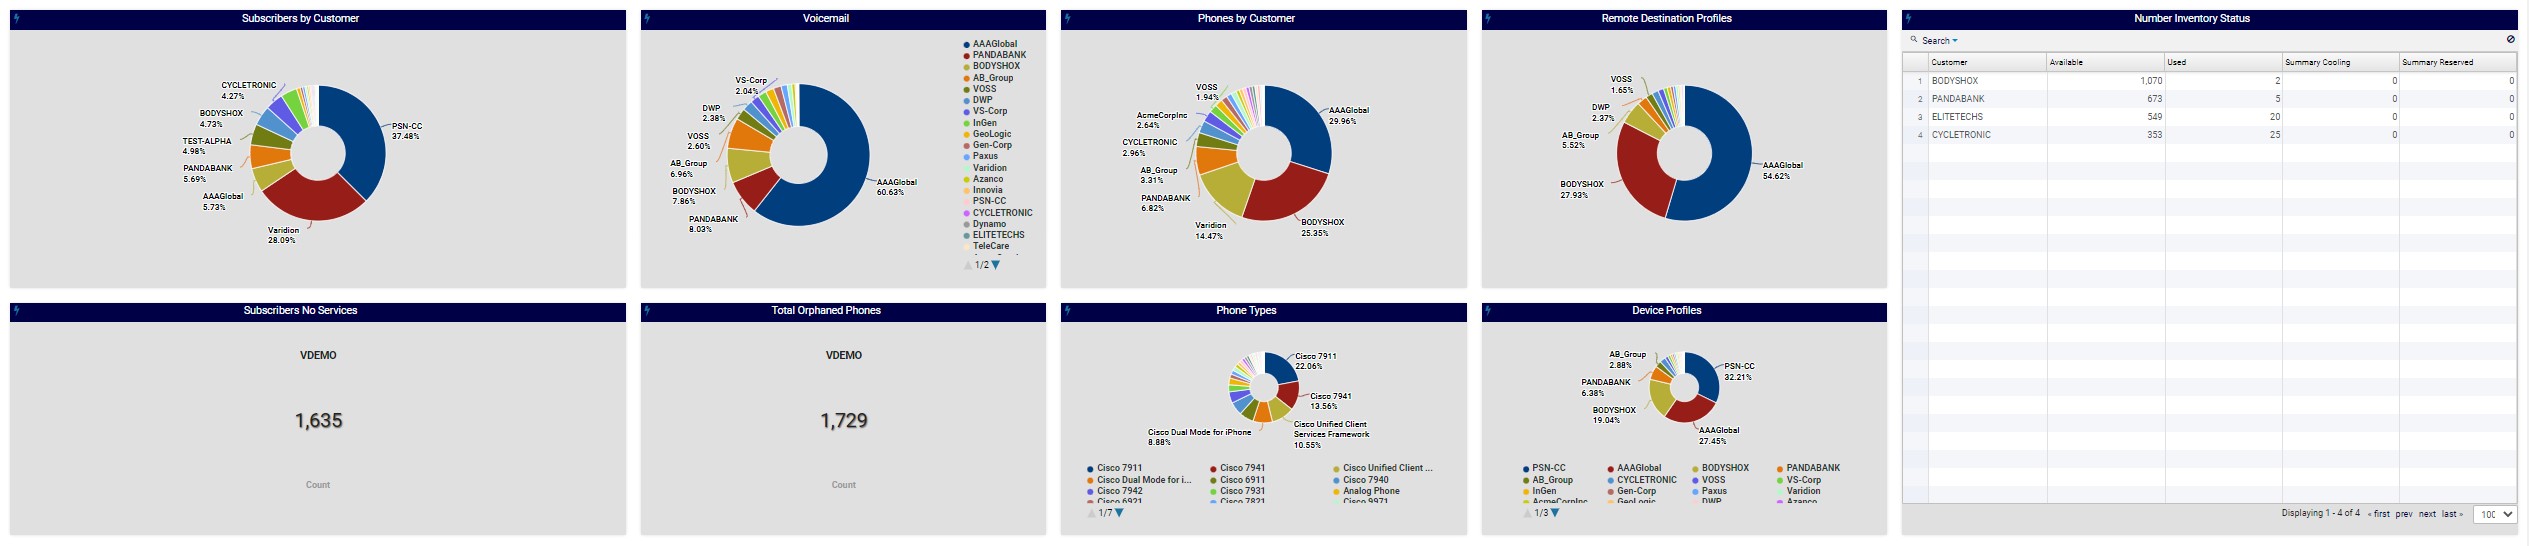
VOSS Analytics Dashboards
VOSS Insights provides the following reference dashboards for VOSS Analytics:
Folder |
Reference Dashboards |
|---|---|
Subscribers / Services / Entitlement |
|
Phones / Devices / Voicemail |
|
Number Inventory / Lines |
|
Transactions |
|
Hunt & Pickup Groups |
|
MsGraph |
|
Webex Teams |
Webex dashboards can be used if your Arbitrator is configured for Webex. |