Log Search
Overview
The Search page stores all log data elements in a JSON index data store.
On this page you can search all data, and add and edit log search/extraction definitions.
You can select the following tabs on this page:
Note
To access the Search page, click the Main Menu icon ![]() , then select the Search
menu at the bottom left of the main menu.
, then select the Search
menu at the bottom left of the main menu.
Search Tab
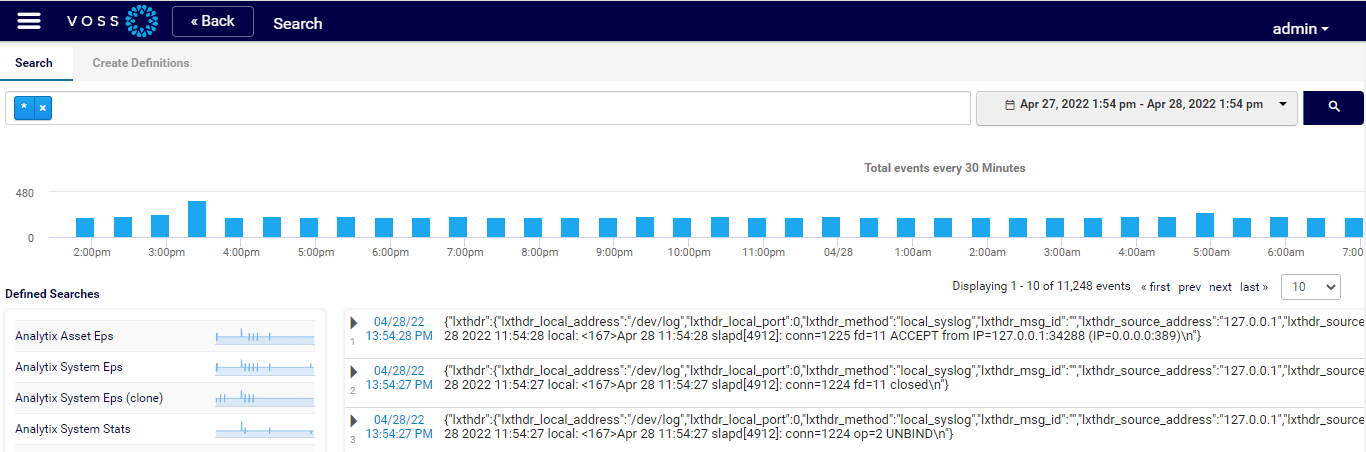
By default, the Search tab displays the last 10 log events to enter the system. Once Logs are collecting, this is where the JSON indexed records will be located. The system builds a library of all words contained in logs.
Search Criteria
A search bar at the top of the page contains a wildcard “*” to display logs. The search bar allows for key word searches using single words or concatenated words with Boolean logic, such as ‘and/or/not’, in addition to using VOSS Insight’s automated Regular Expression engine to perform search extractions and save them as definitions. The search engine displays all words once you’ve typed in the first letters.
The drop-down to the right of the search bar defines the time period to search for logs. The default is the last 24 hours. This setting is important, especially when searching for logs from a source that has stopped sending data, since log data (and the JSON indexed records) are time-based.
To set a date and time range period, click the down-arrow at the drop-down in the Search bar to display a date/time calendar, where you can select a preset period (Last 24 Hours, Last 1 Hour, Last 30 Minutes, Last 5 Minutes) along with a custom date and time selection.
Note
The longer the date range, the more data the system searches, thus the search time period is directly associated to the amount of data over time.
Viewing Search Results
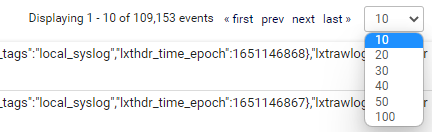
The page displays the number of logs displayed and available, based on the search criteria and the selected date/time range. You can use the first/prev/next/last buttons to skip to navigate the data. The adjacent drop-down allows you to define the number of logs to display on the page.
Bar Graph View of Log Data
The bar graph below the search bar displays the last 24 hours (default) of log events. Each bar represents the quantity of logs collected in each 30 minute interval.
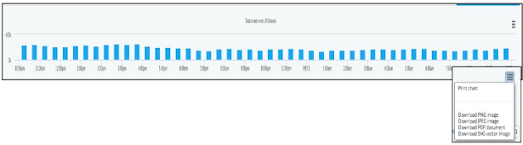
The Chart context menu hamburger icon to the right above the bar graph provides an option to retrieve the graph in multiple formats, for example, to print or download to PDF, to download to PNG, JPEG, or SVG.
The bar graph changes based on the selected data interval, and based on the selected definitions.
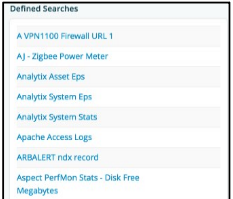
Defined Searches
The Search tab contains a Defined Searches field, which lists all saved search definitions.
A graph to the right of each search definition indicates the amount of logs in that definition, for the time period selected in the time bar.
Select a defined search to refresh the page to display all the logs for that definition. The bar graph also adjusts to reflect the quantities of logs in this definition.
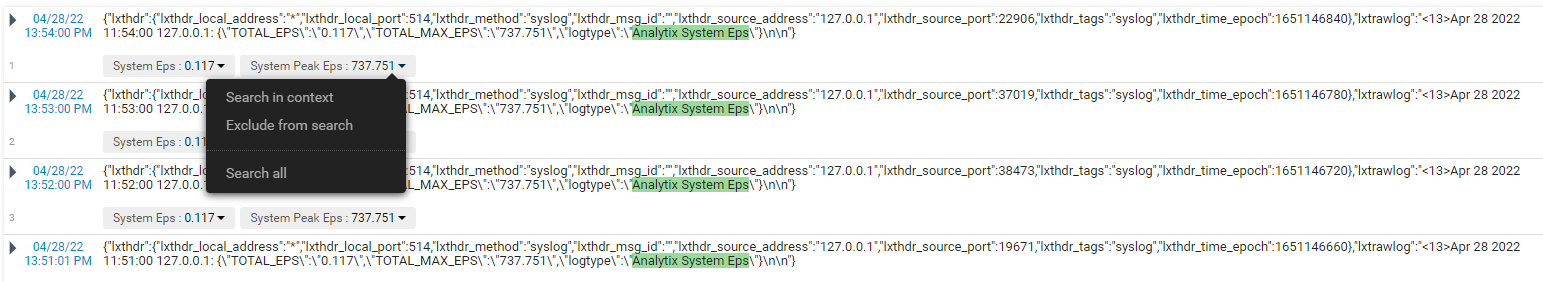
JSON Format Logs
The main body of the Search tab displays the JSON format of the logs associated with the selected search definition. Details below each log are the data fields that have been extracted and are being analyzed on dashboards. A down-arrow at each field opens a dialog that provides search functions to select from:
Search in context |
Searches through all of the selected definition for that field and highlights it. |
Exclude from search |
Searches through all of the selected definition for all data without that field. |
Search all |
Searches the entire log index data store for that field and highlights it. |
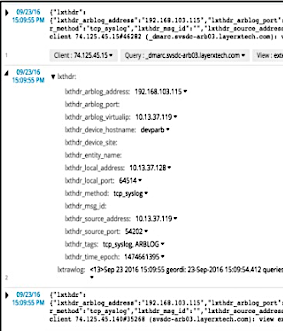
The right-pointing arrow at the left of each log entry allows you to expand the log details, providing information for each component of the logging elements along with a copy of the raw log.
Click the down-arrow within the expanded log view for any item to search (Search in context, Exclude from search, or Search all).
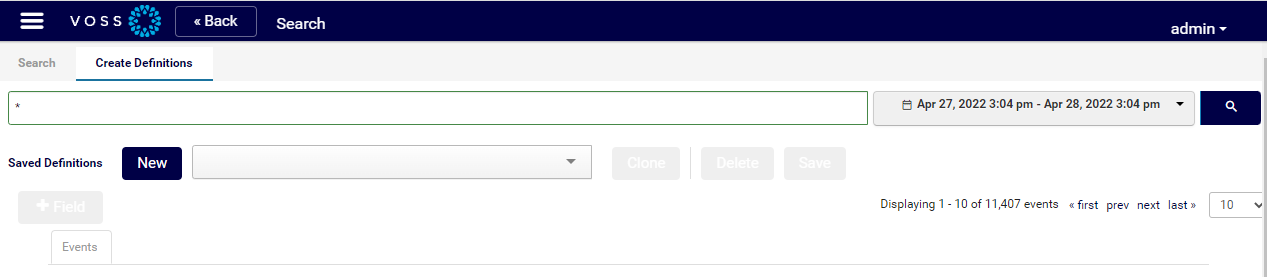
Create Definitions Tab
On the Create Definitions tab you can define the search definitions that display logs on the Search tab.