Default Dashboards
On this page
Default Dashboards
Overview
VOSS Insights Dashboard ships with a number of default dashboards. You can edit or clone the default dashboards to create custom dashboards, or create new dashboards.
Note
This guide provides details for a selection of the default dashboards. To view available dashboards, click the hamburger icon
 .
.Both default and custom dashboards display in the Dashboards pane. If you wish to restore a dashboard to its default value, you can use the Reinstall Packaged Dashboards option via the admin menu (via ssh admin@<IP address>).
Dashboards are based on search definitions that extract data from one or more fields. These may be predefined search definitions that ship with the default dashboards, or definitions that you set up to create custom views of the data to meet the needs of your organization.
If you wish to modify a dashboard, click on the dashboard to open its configuration page, where you can view and edit its widgets, which are populated based on the search definitions defined for the dashboard.
Related Topics
DS9 Dashboards
Note
Starting with release 22.1, default DS9 dashboards are no longer part of the release. Instead, when the configuration DS9 option for Setup new DS9 is run, an entire directory of dashboards for that DS9 are created and all the needed datasources, mapping files and configuration for that DS9 are automatically handled at this time.
If a VOSS Insights DS9 server is installed, dashboards are available for its monitoring.
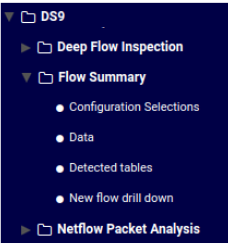
Note that specific flow summary tables are also available for DS9.
Resources such as ds9_netflow_flow_summary, ds9_netflow_flow_1day
and ds9_netflow_detected_internal_flow are for example available to dashboards.
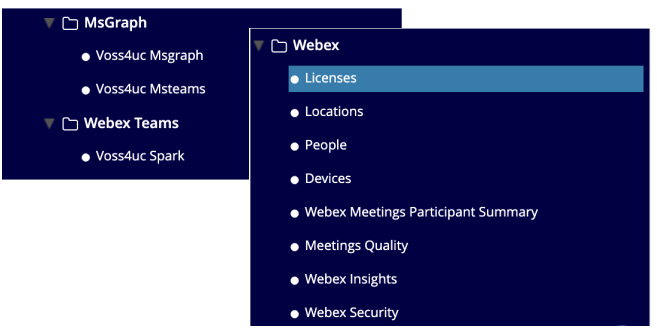
MS Graph Dashboards
New MS Graph dashboards ship with VOSS Insights Dashboard from SP66.
Polycom Dashboards
VOSS Insights Dashboard ships with several default dashboards to provide support for reporting on the health and status of Polycom meeting room devices for audio and video conferencing.
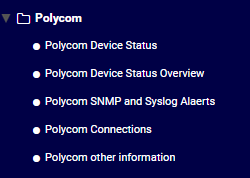
To view the data sources for these dashboards, select the dashboard in the DASHBOARDS panel, then inspect the fields included in the definitions.
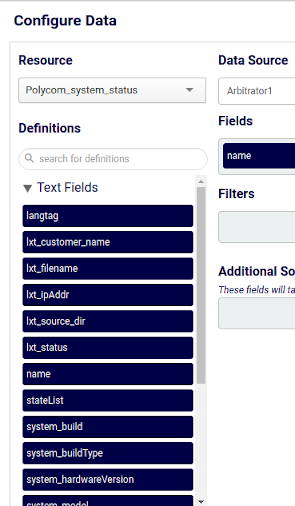
For example Polycom Device Status provides a system, software, and audio dashboard for Polycom devices. Under Polycom Device Status for example, the following fields describe the resource Polycom_system_status under Polycom System - Elements:
lxt_customer_name
lxt_filename
lxt_ipAddr
lxt_source_dir
lxt_status
name
stateList
system_build
system_buildType
system_hardwareVersion
system_model
system_serialNumber
system_softwareVersion
system_state
system_systemName
system_timeServerState
lxt_delete_date
system_systemTime
system_timeOffset
system_uptime
lxt_timestamp_epoch
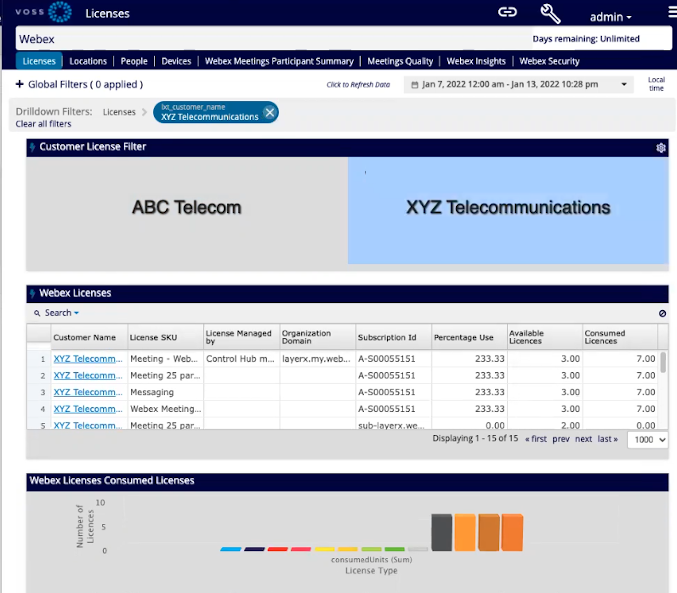
Webex Dashboards
If your Arbitrator is configured for Webex, the Webex dashboards can be used. (Refer to the API Config section in the Configuration chapter of the VOSS Insights Arbitrator Data Correlation Administration and User Guide.)
System Level Availability (SLA) Dashboards
VOSS Insights ships with a number of predefined dashboards that allow you to view and monitor system level availability (SLA) data.
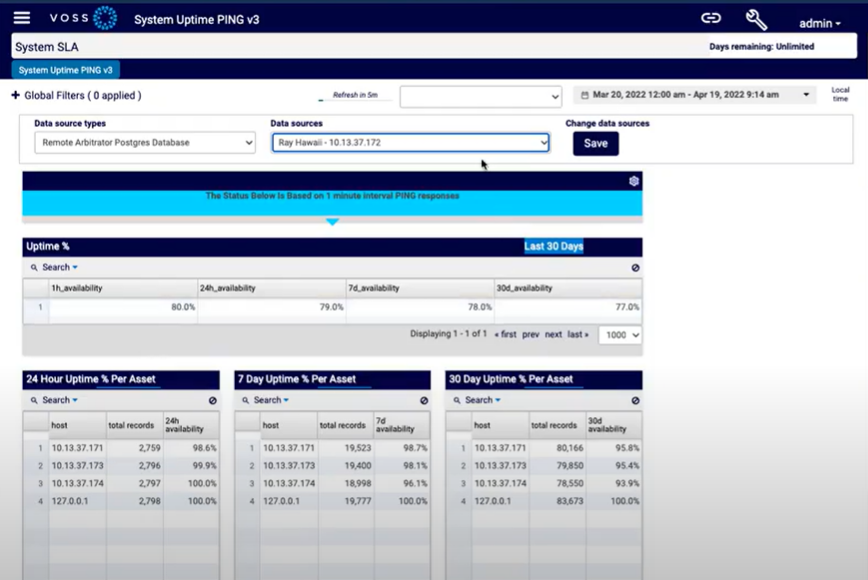
You can use the System Uptime PING v3 dashboard, a SLA dashboard that ships with VOSS Insights (from v22.1), to view live statistics for predefined parameters, such as lxt_connect_time and lxt_total_time, (displayed as dashboard widgets), for a selected Arbitrator.
To set up and use this dashboard:
In Arbitrator, add and configure the PING probe.
In Arbitrator, attach the PING probe to the relevant assets (one or more).
Note
The PING probe ships with VOSS Insights. Once configured and assigned to each device that you wish to monitor, the PING probe stores historical availability results to the database.
In VOSS Insights Dashboard, point to an Arbitrator to view data:
In the DASHBOARDS panel, select System SLA > System Uptime PING v3.
Display the Data source types and Data sources fields (if hidden). To do this:
Click the toolbar Wrench icon, then select Hide/Show to display the Hide Show Options dialog.
Select Show Data source selector, and click Save.
Choose an option:
To view data for a particular widget, click the cog icon on the widget, then select Edit Widget to open the Configure Data dialog. In the Resource drop-down, choose the widget that defines the data you want to view in the dashboard, for example, Day_availability_ping), then choose a data source (the relevant Arbitrator), and click Save.
The dashboard displays data relevant to the widget and the selected data source.
To view data for all widgets (global view), for a selected Arbitrator, choose Data source type
Remote Arbitrator Postgre(global option), then from the Data Source drop-down, choose an Arbitrator.Note
This option provides a live refresh of data for all widgets, for a selected Arbitrator.
To save this global data view, click Save. Alternatively, the page loads data in the widgets, and you can choose another Arbitrator in the Data Source drop-down to load data for the next Arbitrator for which you want to view data.
The page loads fresh data each time you change the value in the Data Source drop-down. Displayed data depends on data available from the Arbitrator for which you’re running the query.
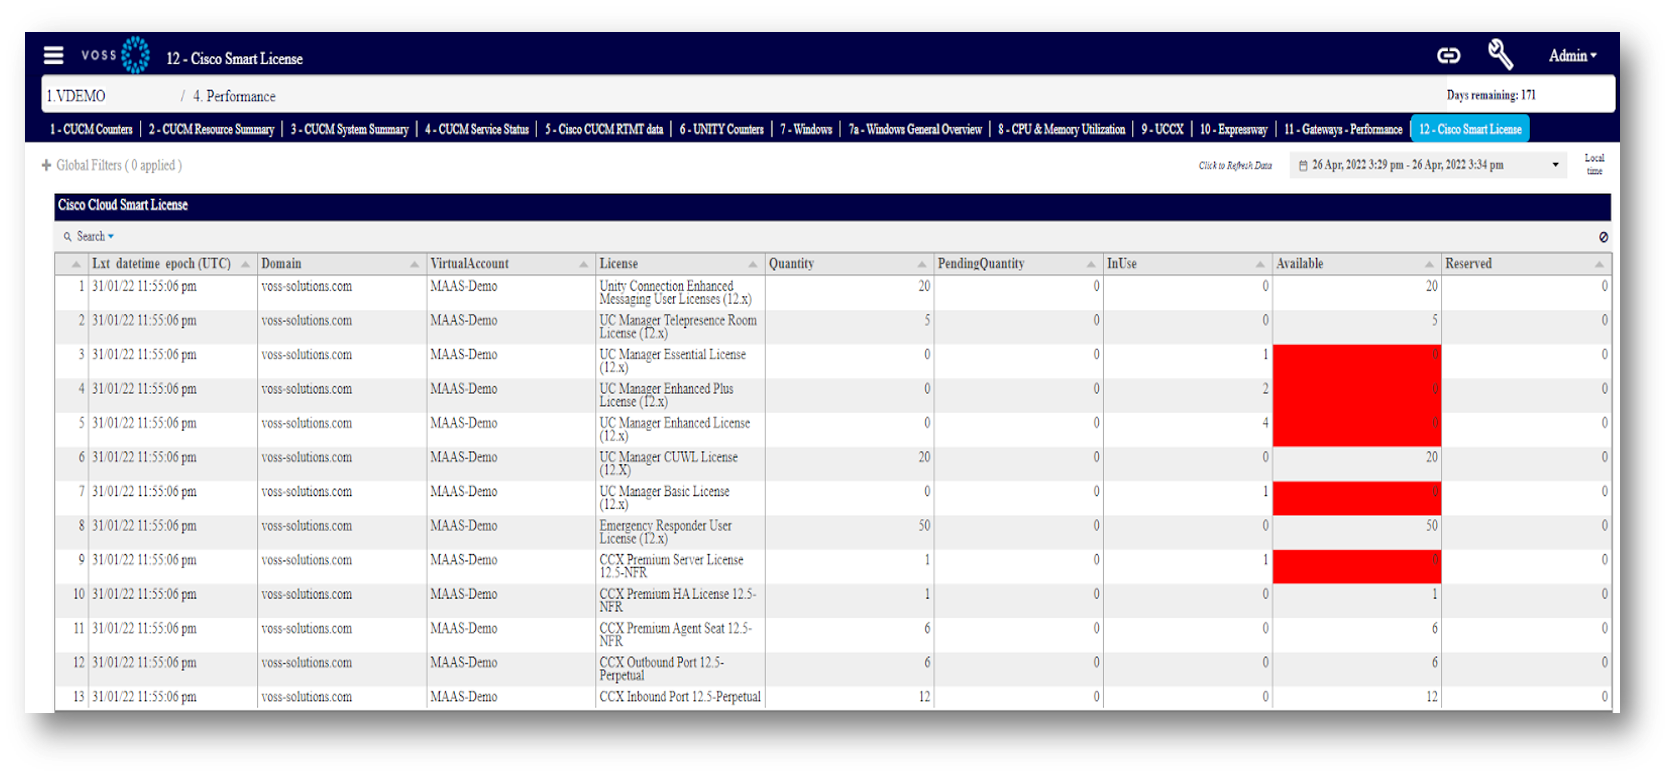
Cisco Smart License Dashboard
This dashboard provides monitoring reports to support management of licenses for Cisco Smart Licensing. For example, to view details for license types and products, to monitor license status and usage over time, and to manage capacity and license costs.
To set up and use this dashboard:
In Arbitrator, add and configure the following probe for Cisco Smart License:
getCiscoSmartLicense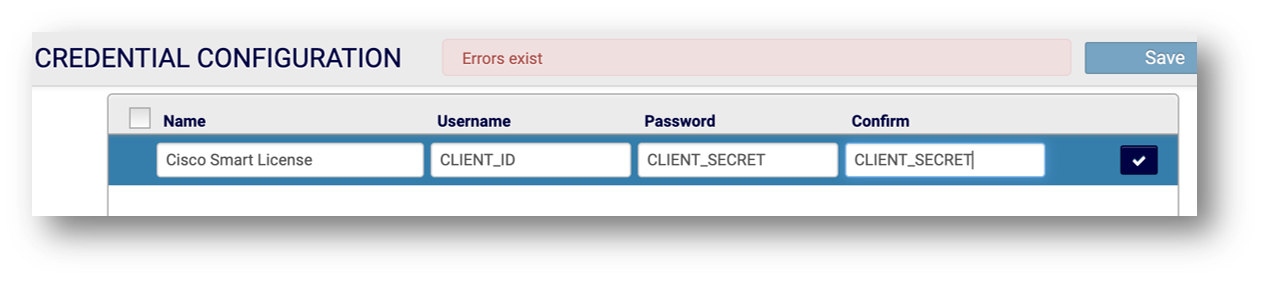
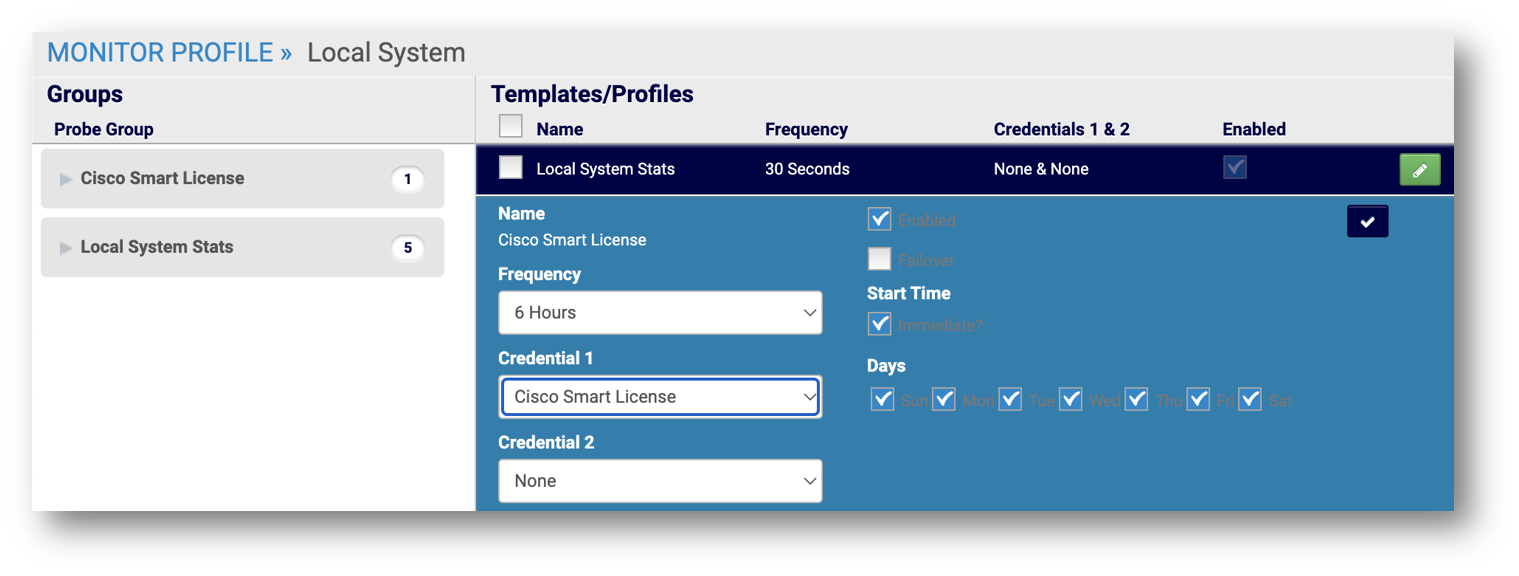
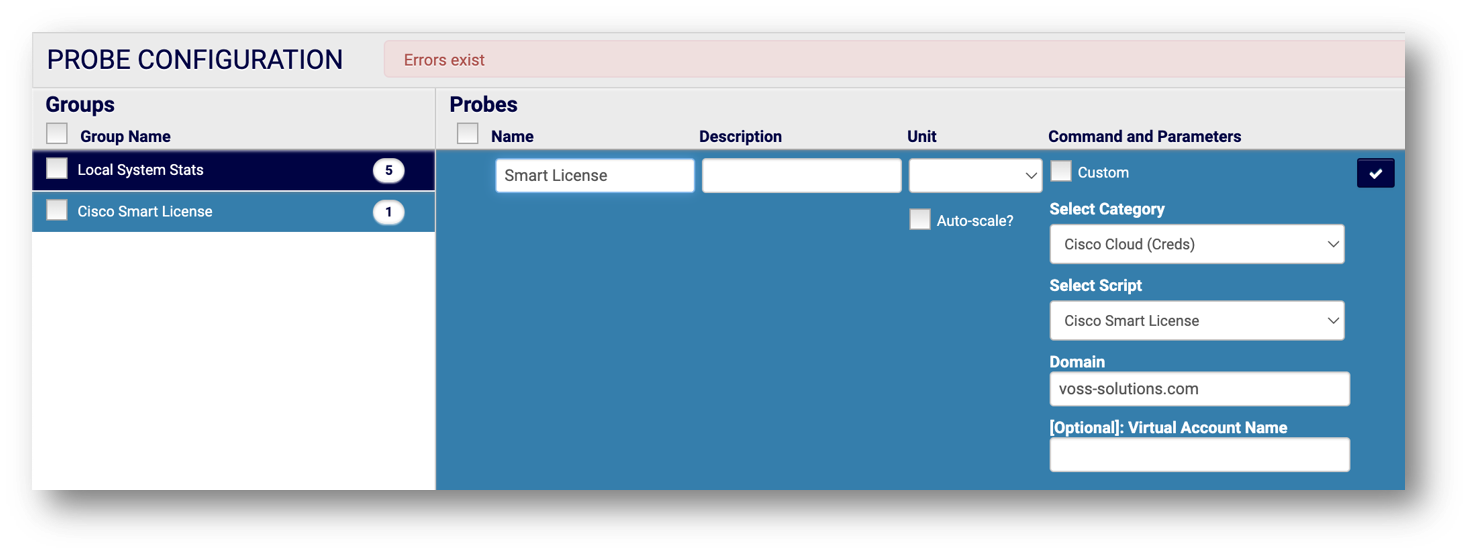
In Arbitrator, attach the probe to the relevant asset.
Note
The getCiscoSmartLicense probe for this dashboard ships with VOSS Insights. Once configured and assigned to the device you wish to monitor, the probe gathers Cisco Smart License data via Cisco Cloud Smart License API. You can view the data via the Cisco Smart License dashboard.
In VOSS Insights Dashboard, select the Cisco Smart License dashboard to view data.
The dashboard screen provides further options for configuring filters and time periods for the data you wish to view.
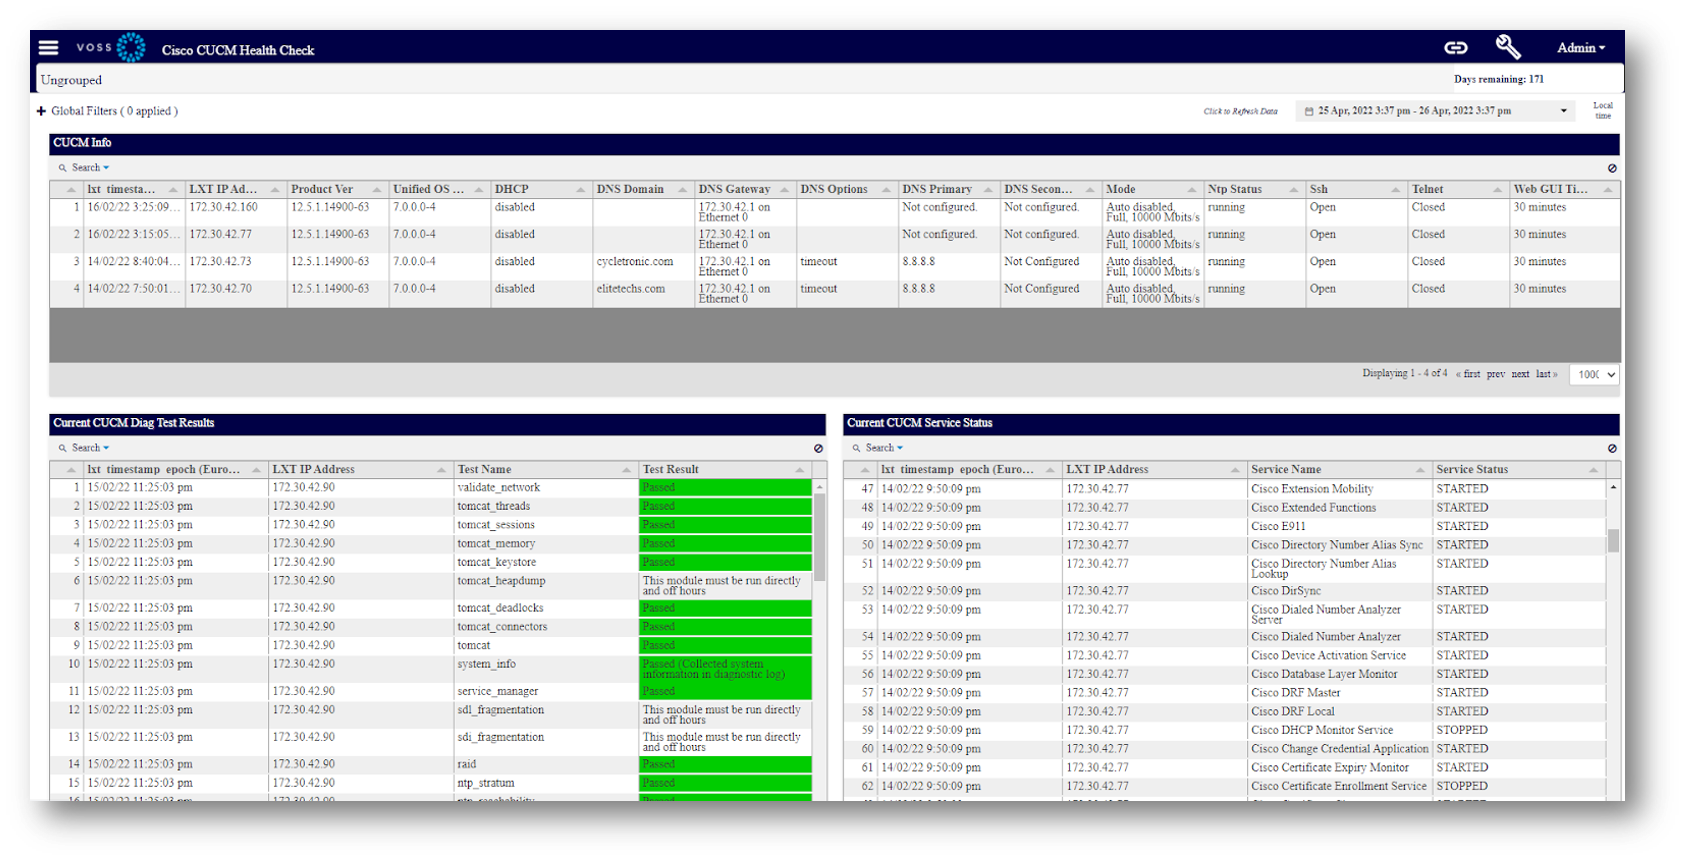
Cisco UCM Health Check Dashboard
VOSS Insights ships with a Cisco UCM Health Check dashboard for reporting on the following data:
Software versions
DHCP
DNS
NTP status
SSH status
Telnet status
Web GUI timeout
CUCM Diag status
DB replication
To set up and use this dashboard:
In Insights Arbitrator, configure the following probes to gather status data from Cisco UCM:
Probe
Commands to run to gather data
getCiscoCucmConfigshow statusshow network eth0show webapp session timeoututils ntp status
ciscoCucmServiceStatusutils service list
ciscoCucmDiagTestutils diagnose test
ciscoCucmDbReputils dbreplication runtimestate
ciscoCucmDisasterRecoverHistoryutils disaster_recovery history backup
In VOSS Insights Dashboard, select the Cisco UCM Health Check dashboard to view data.
The dashboard screen provides further options for configuring filters and time periods for the data you wish to view, based on these predefined definitions:
arbitrator_cisco_cucm_config
arbitrator_cisco_cucm_diagtest
arbitrator_cisco_cucm_dbrep
arbitrator_cisco_cucm_services
arbitrator_cisco_cucm_disaster_recovery_history
You can run the following reports based on the dashboard data:
Pub/Sub/TFTP uptime
Diagnostic tests
NTP Status
Replication
Service status
Backup and disaster recovery
Platform availability
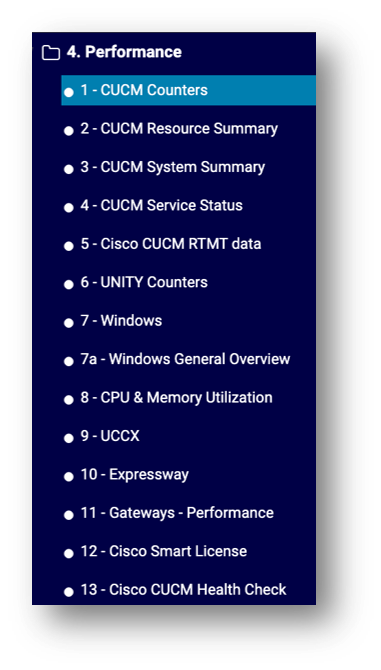
Cisco (Performance) Default Dashboards
The following default dashboards ship with VOSS Insights (from v22.1) to report on performance-related statistics for Cisco devices:
CUCM Counters
CUCM Resource Summary
CUCM System Summary
CUCM Service Status
Cisco CUCM RTMT data
UNITY Counters
Windows (Windows General Overview)
CPU & Memory Utilization
UCCX
Expressway
Gateways - Performance
Select a dashboard in the DASHBOARDS panel to view and configure data for the dashboard.