Introduction to Dashboards
On this page
Introduction to Dashboards
Overview
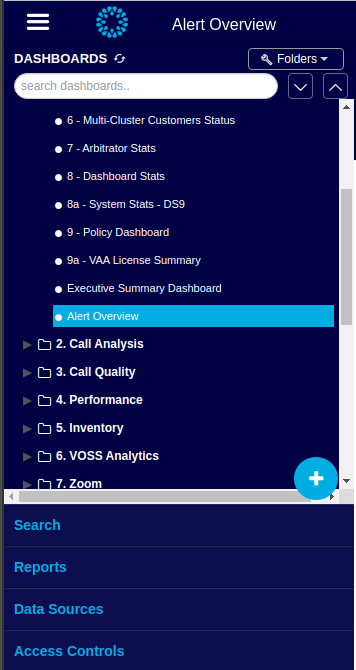
In the Insights Dashboard user interface, the DASHBOARDS panel displays all dashboards, reports, and their associated folders, and the following additional menus, which you can use to work with the dashboards: Search, Reports, Data Sources, Access Controls
Note
Both default and custom dashboards display in the DASHBOARDS panel. If you wish to restore a dashboard to its default value, you can use the Reinstall Packaged Dashboards option via the admin menu (via ssh admin@<IP address>).
Related Topics
Search Dashboards
Use the Search bar at the top of the DASHBOARDS panel to perform a quick search to find dashboards by their name.
View Dashboards
To access the DASHBOARDS panel, click the hamburger icon ![]() .
.
The panel that displays lists the available default and custom dashboards.
Note
Folders and dashboards display only if search definitions have been performed. You will need to create search definitions to view these items.
Add a Dashboard
To create a new dashboard from the DASHBOARD panel, click the Plus (+)
icon ![]() to open the Dashboard Editor.
to open the Dashboard Editor.
Fill out details for the new dashboard, and click Save.
Now you will need to create resource definitions and widgets to use in your dashboard.
Global Filters
Selecting a dashboard in the DASHBOARDS panel displays configuration and display options for that dashboard. One such option is Global Filters, which allows you to configure and apply global filters based on a data element extracted from a search definition and resource defined for the dashboard.
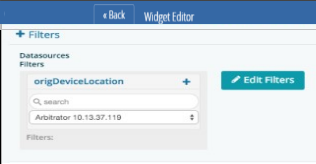
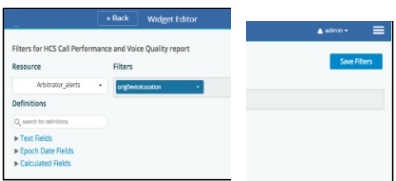
Click Edit Filters to open the Filter Wizard, where you can select the Resource and the Definition to apply as a filter. Once complete click Save Filters to return to the dashboard.
An example of a global filter is producing a performance dashboard by customer location. The widgets on the dashboard are all the performance statistics but the data is filtered by the customer location.
Note
Global filters (and customer filters) work as an IN function that searches for exact string match in SQL. For example:
IN (172.30.42.1, 172.30.42.2)
You must type out all values in the search box (separated by commas), and then press Enter. If you press Enter after selecting each IP address, the search only returns data if all of the IPs are found in the field (which is unlikely).
Dashboard Folders
Dashboards are organized initially in alphabetical order.
When creating dashboards, you can organize these into folders that expand out into trees based on the order you define.
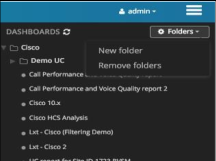
To add a new sub-folder or top-level folder in the DASHBOARDS panel, click the Folders down-arrow and select either New sub folder or New top level folder.
You can drag and drop a sub-folder into the relevant top-level folder, or drag the relevant dashboard into a folder.
To remove a folder, select the folder, then select Remove folder from the Folders drop-down.
Note
Dashboards with the same name can exist in different folders. The names of dashboards in the same folder must be unique.