Project Logs
Project Logs show all Logs that have been created for the currently viewed project. Project Logs are available by clicking on the Logs tab when viewing any project:
Log Dashboard
Upon clicking the Logs tab, a list of the created Logs for that project will be displayed. The list automatically updates every ten seconds, so there is no need to refresh the browser page to obtain the latest data.
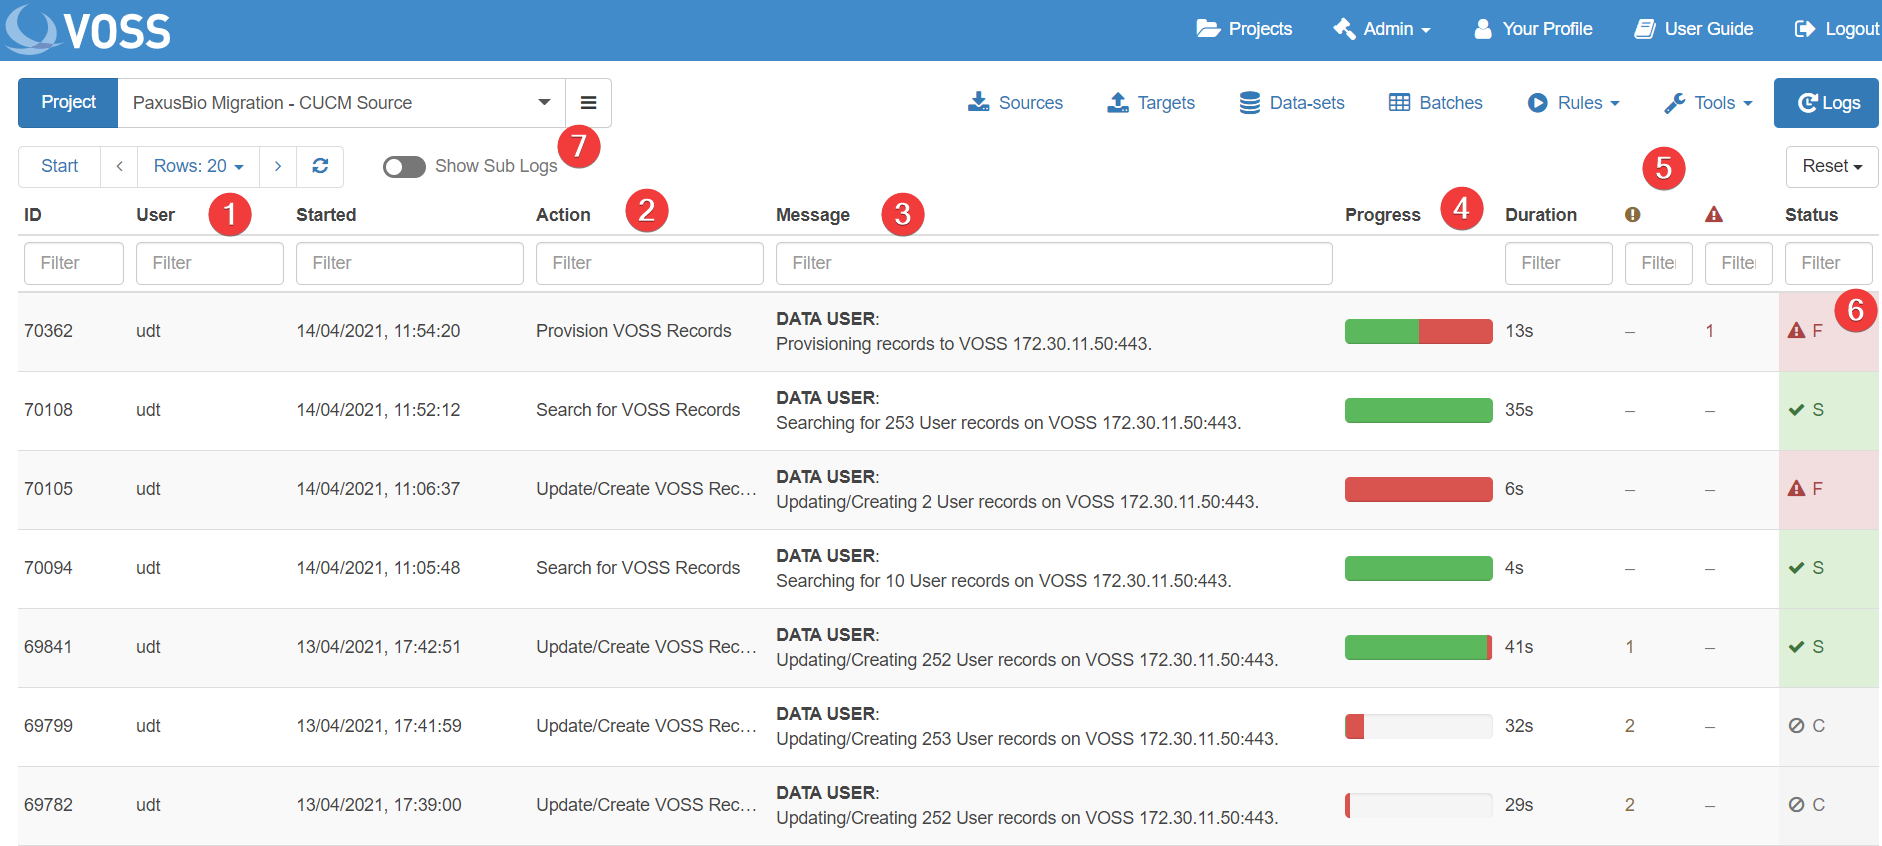
Displayed for each listed Log is the following:
The User who initiated the transaction.
The Action of the Log (i.e. its purpose).
The Message of the Log indicating what it is currently processing. This may change over the course of the Log’s lifetime.
A Progress bar indicating the completion and failure percentage. Hovering over the progress bar produces a tooltip with a detailed count of each.
Two columns indicating a count of Warnings and Errors which occurred while the Log processed. The latter may or may not be reflected in the Progress bar failure percentage.
The current state of the Log. The available states are:
Success (S)
Failed (F)
Processing (P)
Queued (Q)
Cancelled (C)
Warning (W)
A toggle for displaying Sub Logs in the Grid, these are indicated by a down arrow next to the ID.
Clicking on a Log from the list will display the Log Details modal.
Recent Transactions
Instead of clicking on the Log tab, hovering over it will display a widget with the User’s recent transactions for the viewed Project.
This widget initially displays the User’s currently active Logs for the Project (in a Processing or Queued state) from the past three days. As the User creates more Logs, they will be added to the top of the widget automatically.
The widget provides real-time updates of a User’s running transactions, without the need to navigate to the Log dashboard.
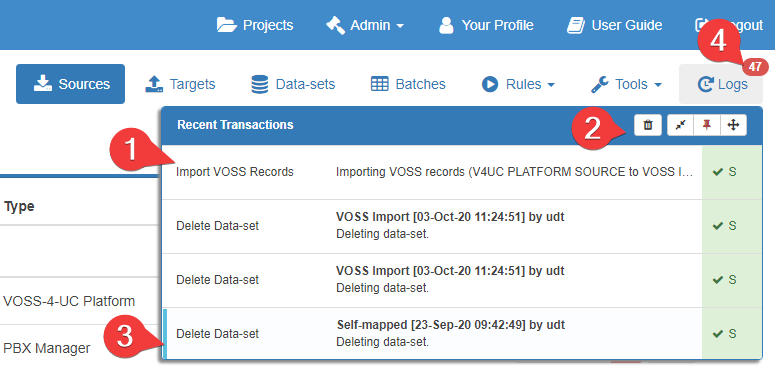
The Logs displayed have reduced information in comparison to the Log dashboard. Shown is the Log Action, Message and State. Clicking on a listed Log will display the Log Details modal.
The action bar provides the following actions (in order of appearance):
Clear Entries: Click to clear the current Log entries from the widget and reset the notifications.
Reset Size: The widget can be resized by dragging any border. Click this to reset the size to default.
Pin: Click for the widget to always display, even after hovering out.
Drag: This icon (or the window bar itself) can be pressed to drag the widget to any place on-screen. After dragging, the widget will always remain on-screen. To revert the widget back to its normal position and hide it, click the previous Pin button.
A Log will have a blue banner at the start if it has just been added or completed. Clicking the Log to open its details will remove the banner.
The Log tab button displays the number of notifications. The number increases as Logs are added or completed and will reduce as the user opens the Log’s details from the widget. Additionally, the icon in the button will spin if widget contains an active Log.
If the widget is unable to receive real-time updates, e.g. because of a connection failure, an error message will be displayed indicating that the connection has been lost:
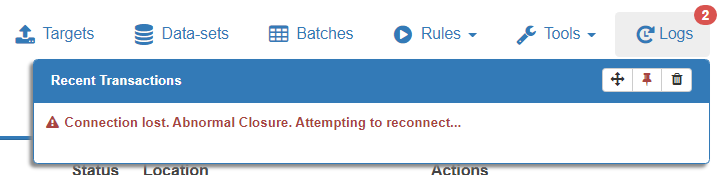
The widget will attempt to re-connect for up to 5 minutes. If the widget is successful in reconnecting it will automatically pick up Log updates since the last time of connection. If the widget does not connect after 5 minutes, it will cease retrying and can only resume working after refreshing the browser page.