
Dashboard Reference#
Filter Options Availability and Definitions#
The operators below are available as filter options for Insights resource field types:
Text#
LIKE (Case Sensitive) - based on the pattern entered in the filter field, will return the data that matches the pattern from the extracted string. This function is case sensitive. An underscore (_) in the pattern indicates matches any single character while a percentage sign (%) indicates matches any sequence of zero or more characters.
NOT LIKE (Case Sensitive) - based on the pattern entered in the filter field, will return the data that does not match the pattern from the extracted string. This function is case sensitive. An underscore (_) in the pattern indicates matches any single character while a percentage sign (%) indicates matches any sequence of zero or more characters.
ILIKE (Case Insensitive) - based on the pattern entered in the filter field, will return the data that matches the pattern from the extracted string. It is not case sensitive. An underscore (_) in the pattern indicates matches any single character while a percentage sign (%) indicates matches any sequence of zero or more characters.
NOT ILIKE (Case Insensitive) - based on the pattern entered in the filter field, will return the data that does not match the pattern from the extracted string. This function is not case sensitive. An underscore (_) in the pattern indicates matches any single character while a percentage sign (%) indicates matches any sequence of zero or more characters.
Equals (=) - based on the pattern entered in the filter field, will return the data that is equal to the pattern from the extracted string.
Not Equal (!=) - based on the pattern entered in the filter field, will return the data that is not equal to the pattern from the extracted string.
IN - based on the pattern entered in the filter field, will return the data that exists within a comma separated list, i.e. 1, 2, 3, 4.
NOT IN - based on the pattern entered in the filter field, will return the data that does not exist within a comma separated list, i.e. 1, 2, 3, 4.
REGEX (Case Sensitive) - utilizes POSIX Regular Expressions to extract data. It is case sensitive.
REGEX (Case Insensitive) - utilizes POSIX Regular Expressions to extract data. It is not case sensitive.
EXCLUDE REGEX (Case Sensitive) - utilizes POSIX Regular Expressions to extract the data that does not match the pattern. It is case sensitive.
EXCLUDE REGEX (Case Insensitive) - utilizes POSIX Regular Expressions to extract the data that does not match the pattern. It is not case sensitive.
Integer#
Less Than (<) - based on the value entered in the filter field, will return the data that is less than the value from the extracted string.
Greater Than (>) - based on the value entered in the filter field, will return the data that is greater than the value from the extracted string.
Less Than or Equal (<=) - based on the value entered in the filter field, will return the data that is less than or equal to the value from the extracted string.
Greater Than or Equal (>=) - based on the value entered in the filter field, will return the data that is greater than or equal to the value from the extracted string.
Equals (=) - based on the value entered in the filter field, will return the data that is equal to the value from the extracted string.
Not Equal (!=) - based on the value entered in the filter field, will return the data that is not equal to the value from the extracted string.
IN - based on the values entered in the filter field, will return the values that exists within a comma separated list, i.e. 1,2,3,4.
NOT IN - based on the values entered in the filter field, will return the values that does not exist within a comma separated list, i.e. 1,2,3,4.
REGEX (Case Sensitive / Insensitive) - utilizes POSIX Regular Expressions to extract data.
EXCLUDE REGEX (Case Sensitive / Insensitive) - utilizes POSIX Regular Expressions to extract the data that doesn’t match the pattern.
Chart Options Availability and Definitions#
Chart Option Definitions:
Series Limit: Maximum number of groups to display on a chart.
All: (default) show all values
<number>: show maximum <number> values
Description: Allows you to enter a description of the chart to be displayed along the top portion of the chart.
Over Time: By selecting this check box the chart will display the data over the specified time based on the Interval, i.e. Minute, Hour, Daily, Weekly and Monthly.
Interval: Used by Over Time: Minute, Hour, Daily, Weekly and Monthly.
X Title: Text label displayed along the bottom of the X axis of column and line charts.
Y Title: Text label displayed along the bottom of the Y axis of column and line charts.
Is Stacked: By selecting this check box the chart will stack values by Stack Type.
Stack Type: Only for column charts. By selecting this box the chart will stack the values based on the type selected:
None: (default) no stacking; individual columns for data
Normal: data stacked into a single column, color coded with values
Percentage: data stacked into a single column, color coded with percentages
Numeric Precision: Select the decimal precision displayed for each point.
Is Horizontal: By selecting this check box, the chart will display the columns/bars horizontally across the chart.
Is 3D: By selecting this check box, column charts and pie charts will be displayed in a 3D representation.
Show Labels: By selecting this check box, each value that defines the chart will be labeled on the chart.
Show Legend: By selecting this check box, the Field Definition for the values being charted will be displayed in the selected position on the chart with the associated color representation.
Gauge Label: Labels the middle of the gauge with value from field extraction.
Min and Max: Place the starting value (Min) and the ending value (Max) for the gauge needle to traverse, e.g. start at 0 and end at 60,000.
Label Inside: By selecting this check box the value will be labeled with the definition based on the field extraction.
Show Bands: By selecting this check box then the gauge will have a maximum of 3 colored bands indicating certain severity levels. These are user defined thus a good, minor and major severity can be easily defined based on the data elements extracted. Simply place values for each color in the associated box to represent the percentage of the gauge band that color is to occupy. Tip: Make your major issue (Red) 100 thus simply modifying the good and minor automatically recalculates the major.
Is Doughnut: A pie chart is displayed with a hole in the middle.
Show Numbers: A pie chart by default shows slices as a percentage. Use this option to instead show the values of the percentage.
Available Chart Options vary according to the chart type:
Chart Option |
Column Chart |
Gauge Chart |
Line Chart |
Pie Chart |
|---|---|---|---|---|
Series Limit |
X |
X |
X |
|
Description |
X |
X |
X |
|
Over Time |
X |
X |
||
Interval |
X |
X |
||
X Title |
X |
X |
||
Y Title |
X |
X |
||
Is Stacked |
X |
|||
Stack Type |
X |
|||
Numeric Precision |
X |
|||
Is Horizontal |
X |
|||
Is 3D |
X |
X |
||
Show Labels |
X |
X |
X |
|
Show Legend |
X |
X |
X |
|
Gauge Label |
X |
|||
Min |
X |
|||
Max |
X |
|||
Label Inside |
X |
|||
Show Bands |
X |
|||
Is Doughnut |
X |
|||
Show Numbers |
X |
Drilldown Options and Conditional Syntax#
Drilldown Options#
Filter Options: apply to field value match of a selection of the chart or table data (IN, REGEX)
For example, if Filter Other Widgets is selected, then IN will match “Ann” exactly in other widgets and REGEX will match “Ann”, “Anne”, “Annie”.
Drilldown Options: the behavior when selecting an item in a chart or table
None (default)
Filter Other Widgets: a selected drilldown item will update any other widget that also references the same data instance.
For example a drilldown on a CUC user table where this is enabled, will similarly impact widgets such as charts, counters and tables related to CUC users, so that these widgets will then reflect data from only the single user from the drilldown.
In the example below, the chart widget called CUCM User count by Dept has the Filter Other Widgets drilldown filter enabled, so that for example selecting a department from the chart also filters the CUCM Users count per site chart to only show users at sites belonging to the selected department. The department filter (here:
department contains 'Cats Beauty') is also displayed when the filter is active.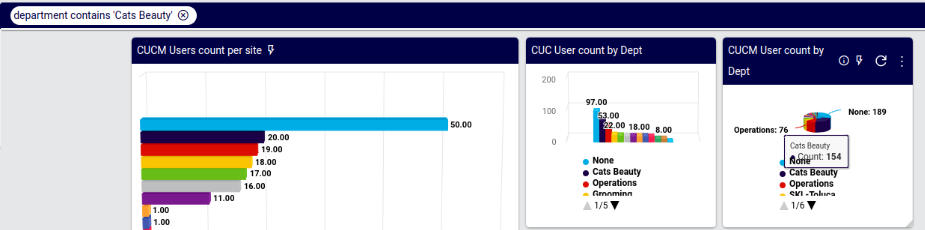
Link to Another Dashboard
Used to open another existing widget during drilldown. A Dashboards dropdown shows to select the other dashboard.
Launch Third-party URL
Launch a system URL in the system portal. The format of the input is an endpoint relative to the portal:
https://<hostname>/portal/. For example, if the value entered is#/admin, then the drilldown will launch the admin home page dashboard:https://<hostname>/portal/#/admin.Launch an external, non-system URL in the system portal (if allowed). The format of the input is the full external URL:
https://<eternal-host>
Conditional Drilldown
Provides a Conditional Drilldown input box into which a JSON formatted condition can be entered. For details on the format, see Conditional Drilldown Format below.
Drilldown Fields:
Field Name: if multiple Field values were added for a Resource, select a field for the drilldown.
Conditional Drilldown Format#
When selecting the Conditional Drilldown option, the condition needs to be entered in JSON format into the input box. This section provides syntax details and examples for this configuration.
If an item matching the condition is selected from the dashboard, the conditional drilldown is then carried out.
The JSON format is outlined below.
If
conditionsare all metthen carry out
actionselse Defaults (
"default...")Structure:
{ "conditions": [], "actions": [], "defaultDrilldown": 1, "defaultDashboardId": "", "defaultUrl": "", "defaultFilterFields": [] }conditions:conditions: list of conditions onrules.id: “integer” - zero-basedname: “text” - condition nametype: “OR” or “AND”conditions.type: “AND” means action will be taken when all conditions are met.conditions.type: “OR” means action will be taken when one condition is met.
rules:rules: list of rules:ruleid: “integer” - zero-basedfield: “integer” - zero-basedField order in the drilldown tab (0 base)
fieldType: “text”, “integer” or “float”operator: “==”, “!=”, “<=”, “>=”, “<”, “>” or “regex”operator: “==”, “!=”, “<=”, “>=”, “<”, “>” or “regex”fieldTypetextoperatorchoices: “==”, “!=”, “regex”fieldTypeinteger and floatoperatorchoices: “==”, “!=”, “<=”, “>=”, “<”, “>”
value: value of the field; according tofieldType: “text”, “integer” or “float”
actions:List of actions:
drilldown: “integer”Drilldown type:
1 (drilldown to other widgets)
2 (drilldown to other dashboard:
dashboardid)4 (drilldown to external link:
url)
dashboardid: “text”The ID is available as
dashboard_idURL parameter value when on a dashboard.url: “text”The value is a URL containing position variables for
filterFieldsreferences, whose values in turn are substituted into the URL. The position variables are one based, for example:"url": "https://{1}/ui/index.html?{2}"refers to the first and second
filterFieldslist entries, which in turn take the format"filterFields": [0,1]The value of the first
filterFieldsentry is therefore for example substituted into the URL variable{1}above.filterFields: list of fields (“integer” = index number)Field order in the drilldown tab (0 base)
Defaults:
defaultDrilldown: “integer”defaultDashboardid: “text”defaultUrl: “text”defaultFilterFields: list of fields (“integer” = index number)Field order in the drilldown tab (0 base)
Examples#
Drilldown to other widgets
Explanation:
If 7th field (
"field": 6) data != 0 and 6th field ("field": 5) <= 0 thenrun action drilldown to other widgets (
"drilldown": 1)using filter values of first, second and 4th field (
"filterFields": [0,1,3]).
If the condition is not met, then
run default action which is drilldown to other widgets (
"defaultDrilldown": 1)using filter values of first and second field.
JSON:
{
  "conditions": [
    {
      "id": 0,
      "name": "first_condition",
      "type": "AND",
      "rules": [
        {
          "ruleid": 0,
          "field": 6,
          "fieldType": "integer",
          "operator": "!=",
          "value": "0"
        },
        {
          "ruleid": 1,
          "field": 5,
          "fieldType": "float",
          "operator": "<=",
          "value": "0"
        }
      ],
      "actions": [
        {
          "drilldown": 1,
          "dashboardid": "",
          "url": "",
          "filterFields": [
            0,
            1,
            3
          ]
        }
      ]
    }
  ],
  "defaultDrilldown": 1,
  "defaultDashboardId": "",
  "defaultUrl": "",
  "defaultFilterFields": [
    0,
    1
  ]
}
Drilldown to other dashboard
Explanation:
If second field data is “keller, texas” or 5th field is “TX” then
run action drilldown to other dashboard (
"drilldown": 2,"dashboardid":...)using filter values of first, second and 4th field.
If the condition is not met, then
run default action which is drilldown to other widgets
using filter values of first and second field.
JSON:
{
  "conditions": [
    {
      "id": 0,
      "name": "first_condition",
      "type": "OR",
      "rules": [
        {
          "ruleid": 0,
          "field": 1,
          "fieldType": "text",
          "operator": "==",
          "value": "keller, texas"
        },
        {
          "ruleid": 1,
          "field": 4,
          "fieldType": "text",
          "operator": "==",
          "value": "TX"
        }
      ],
      "actions": [
        {
          "drilldown": 2,
          "dashboardid": "M2OQQMVN3IWI1O2P1686581558847Y2FRT98M8V24GS",
          "url": "",
          "filterFields": [
            0,
            1,
            3
          ]
        }
      ]
    }
  ],
  "defaultDrilldown": 1,
  "defaultDashboardId": "",
  "defaultUrl": "",
  "defaultFilterFields": [
    0,
    1
  ]
}
Drilldown to external link
Explanation:
If second field data is “keller, texas” or 5th field is “TX” then
run action drilldown to other external link
using filter values of first and second field.
If the condition is not met, then
run default action which is drilldown to other widgets
using filter values of first and second field.
JSON:
{
  "conditions": [
    {
      "id": 0,
      "name": "first_condition",
      "type": "OR",
      "rules": [
        {
          "ruleid": 0,
          "field": 1,
          "fieldType": "text",
          "operator": "==",
          "value": "keller, texas"
        },
        {
          "ruleid": 1,
          "field": 4,
          "fieldType": "text",
          "operator": "==",
          "value": "TX"
        }
      ],
      "actions": [
        {
          "drilldown": 4,
          "dashboardid": "",
          "url": "https://{1}/ui/index.html?{2}",
          "filterFields": [
            0,
            1
          ]
        }
      ]
    }
  ],
  "defaultDrilldown": 1,
  "defaultDashboardId": "",
  "defaultUrl": "",
  "defaultFilterFields": [
    0,
    1
  ]
}