 VOSS Insights Documentation
Latest Release: VOSS Insights Docs 23.3
Do more with VOSS Insights 23.3! This release ships with a fresh new look and feel for the Dashboard product, including new ways to navigate and explore your dashboards. We've redesigned the way we collect and visualize Microsoft Teams data, resulting in enhanced dashboards for Microsoft Teams. The introduction of Digital Experience Monitoring into the Arbitrator delivers additional metrics for testing connectivity to web-based systems, such as Microsoft Teams. See the Release Notes for details.
Resources for this release
new_releases Release Notes 23.3link Release Deck | picture_as_pdf Download
link Explore HTML docs on the portal
archive Download zip file (all PDFs)
Get started
Go to Documentation
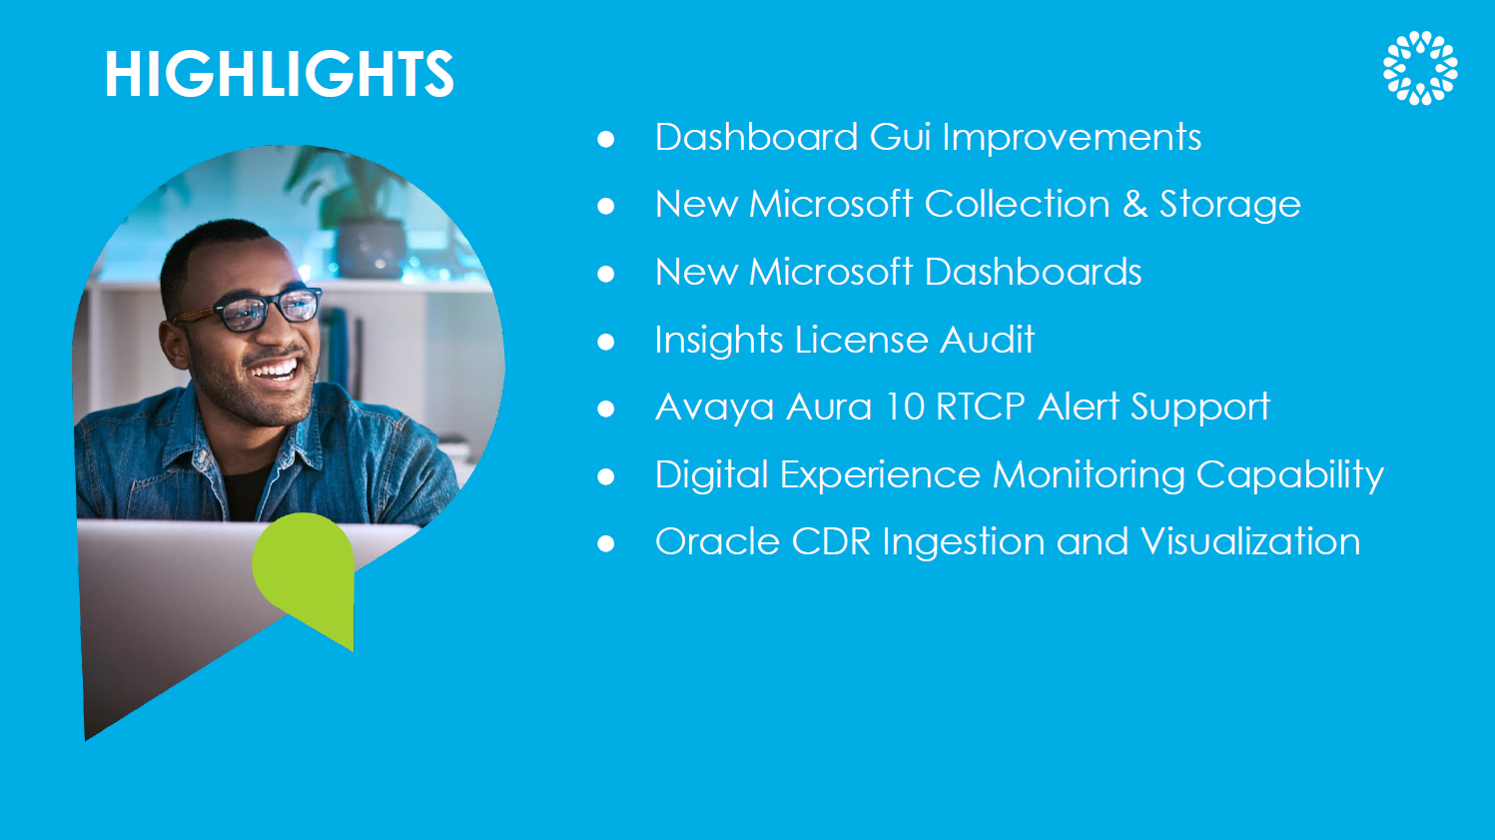
See what's new in Insights 23.3
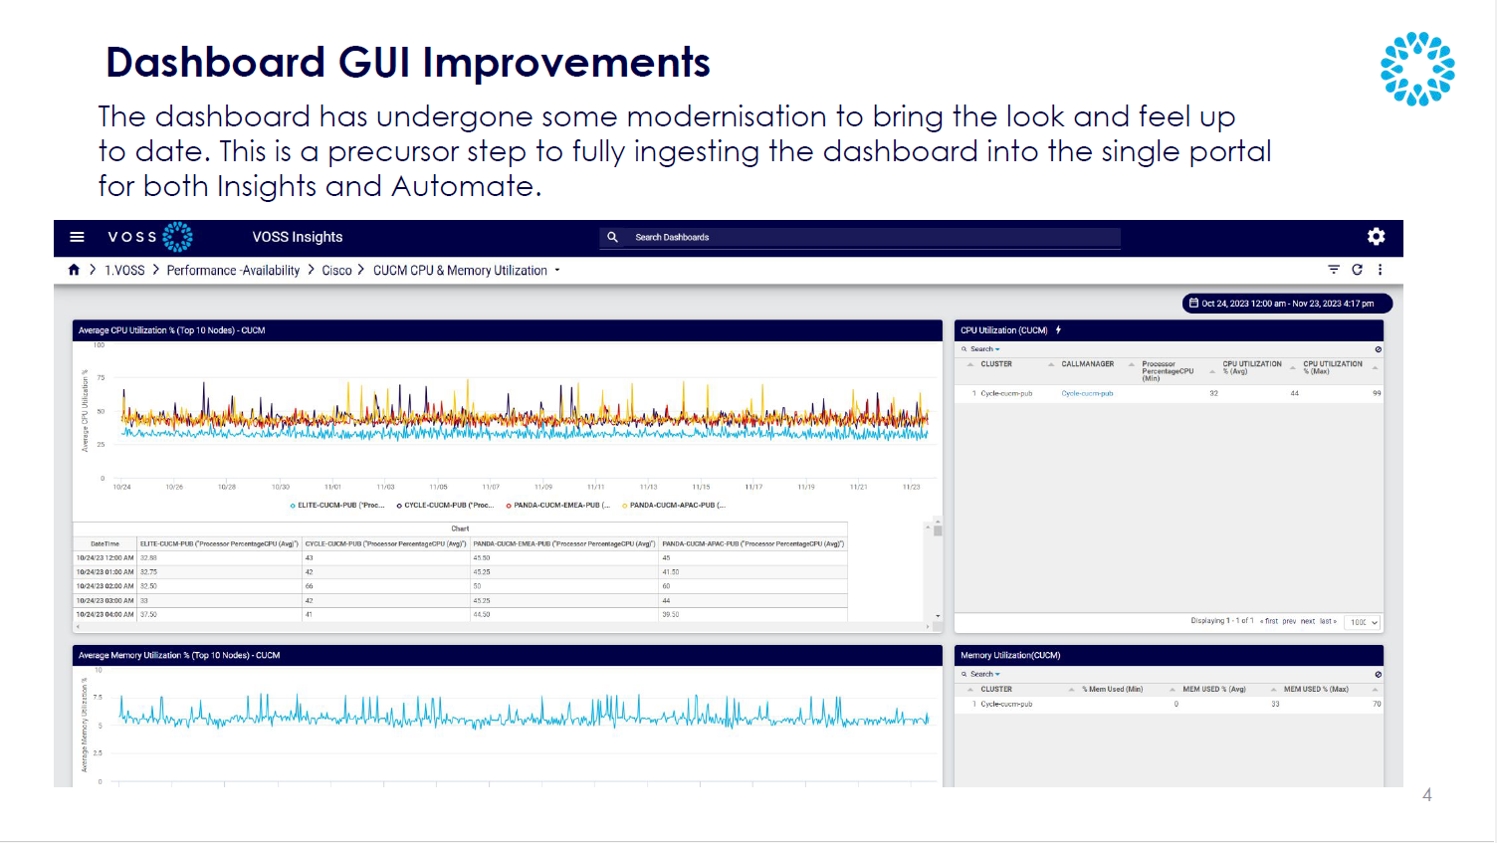
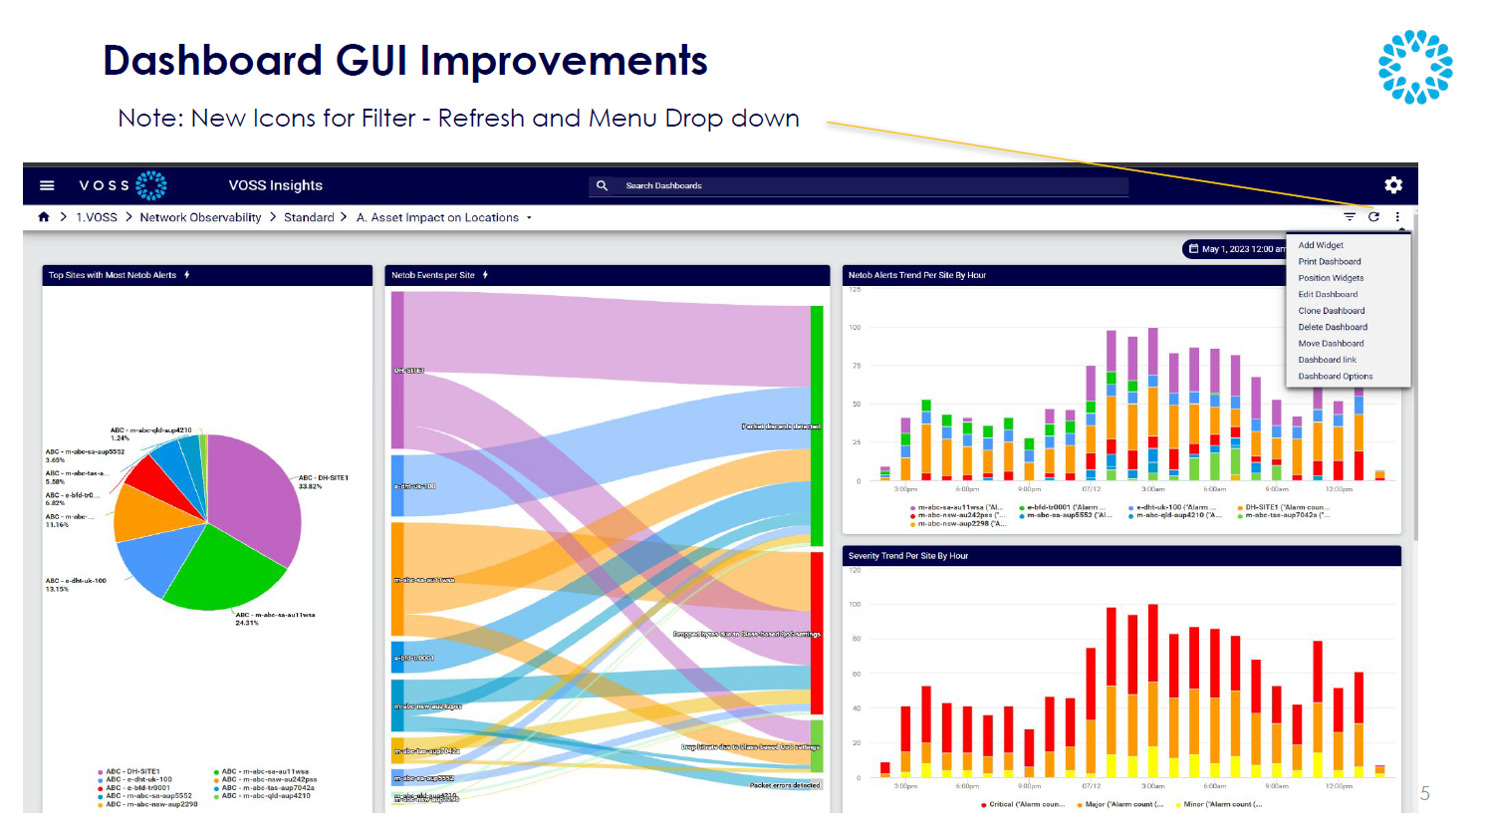
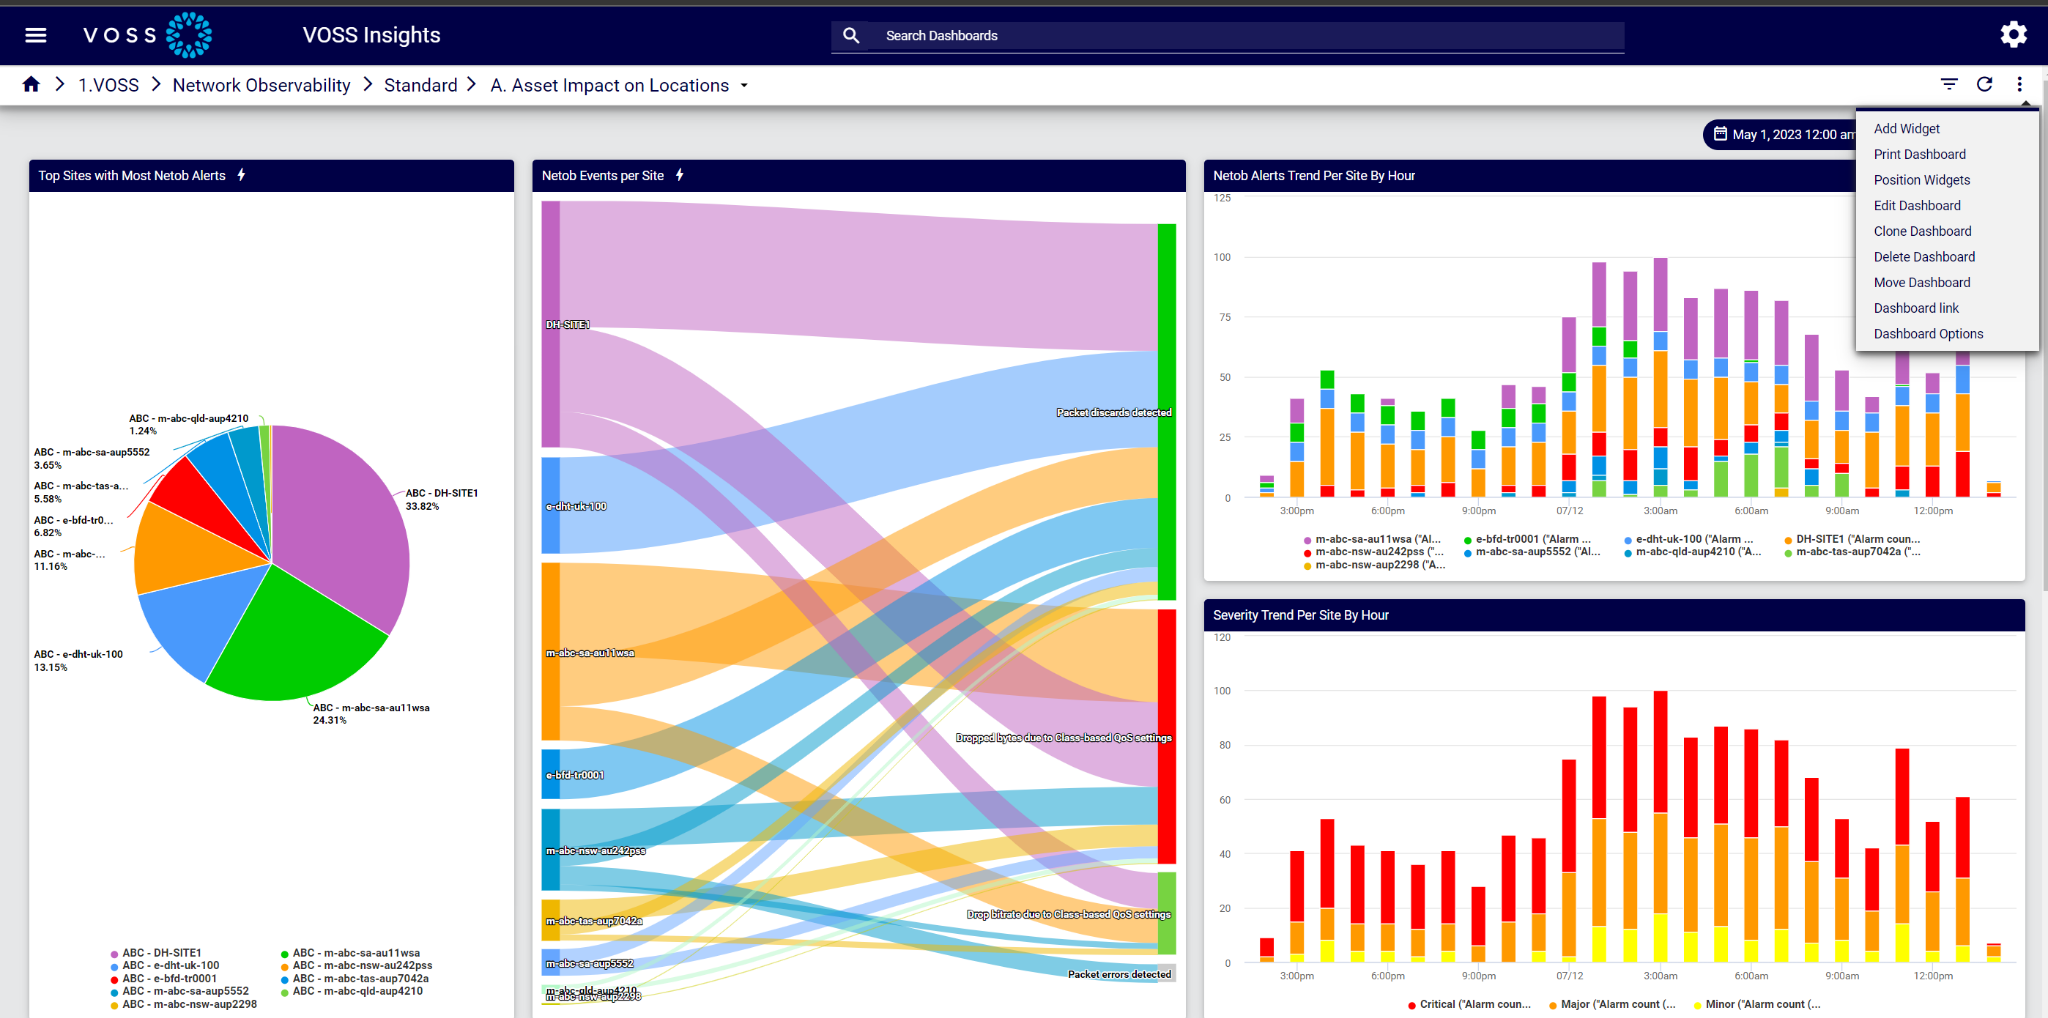
Dashboard GUI Improvements
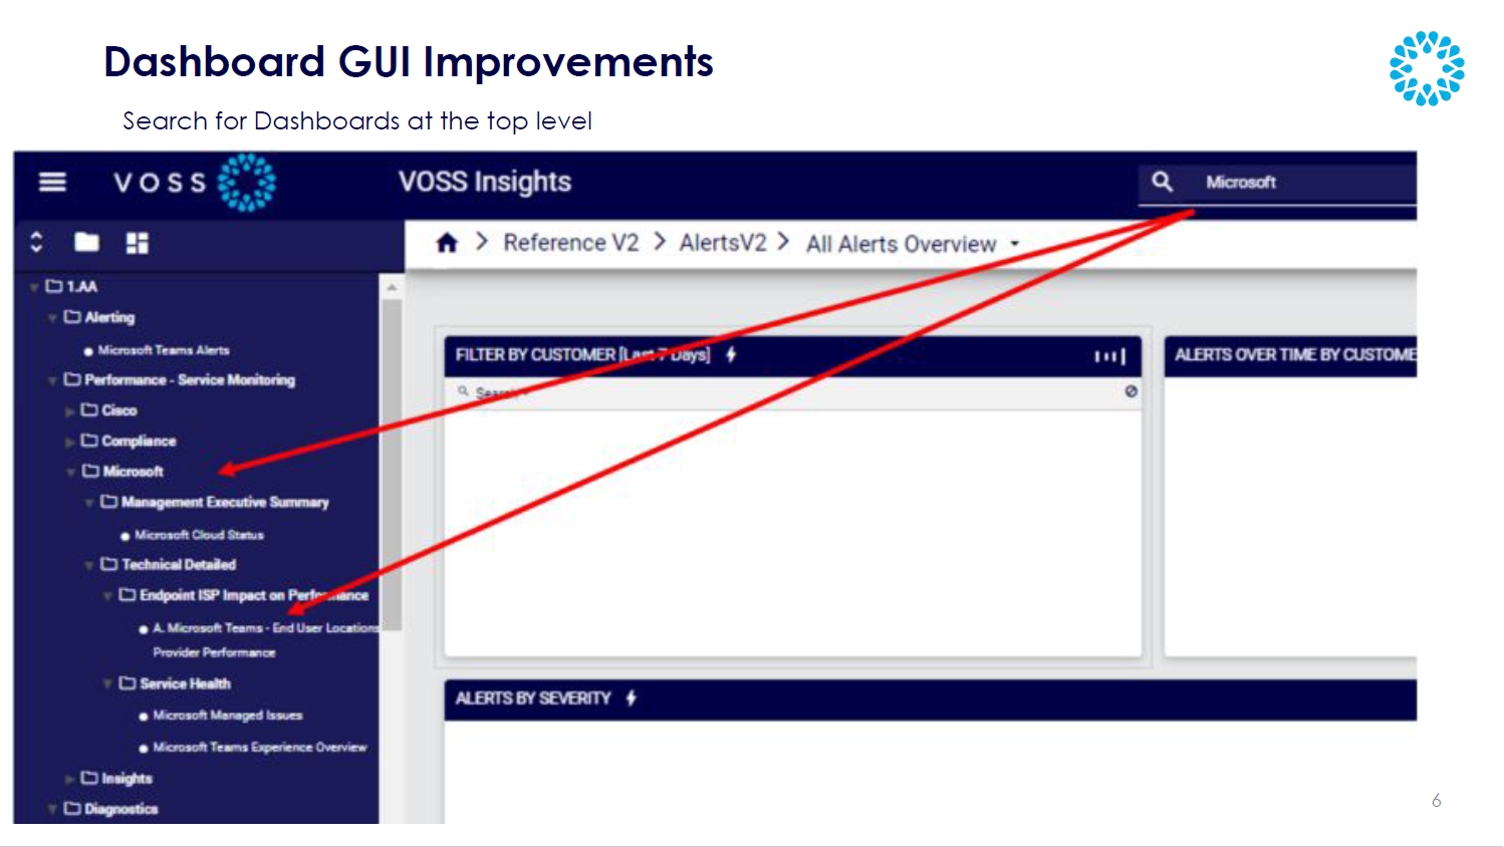
The refreshed Insights Dashboard product ships with improvements to the layout and look and feel to enhance the overall user experience and general usability. We've updated icons and colors throughout, and deliver exciting visualizations for the high quality bar, graph, and detailed data we ship as standard. You can now search for dashboards directly from an easily accessible Search bar on the toolbar, click the breadcrumbs for any dashboard you have open to explore related folders and sub folders in the tree, and explore new quick access menus for managing dashboards.
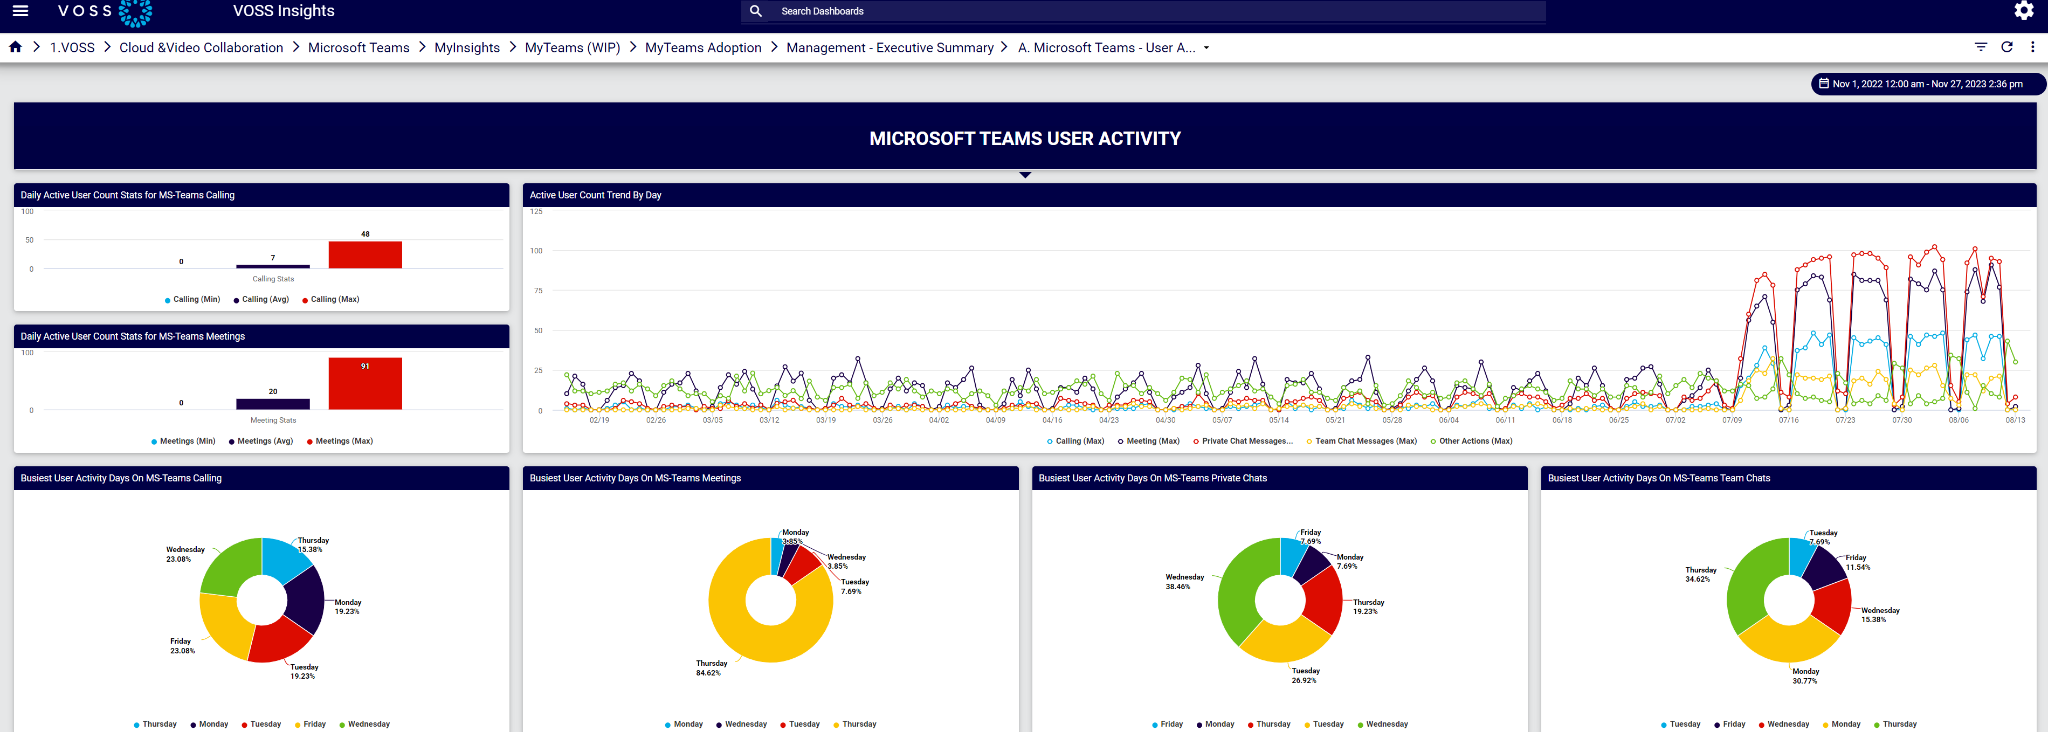
Microsoft Teams Dashboards and Reporting
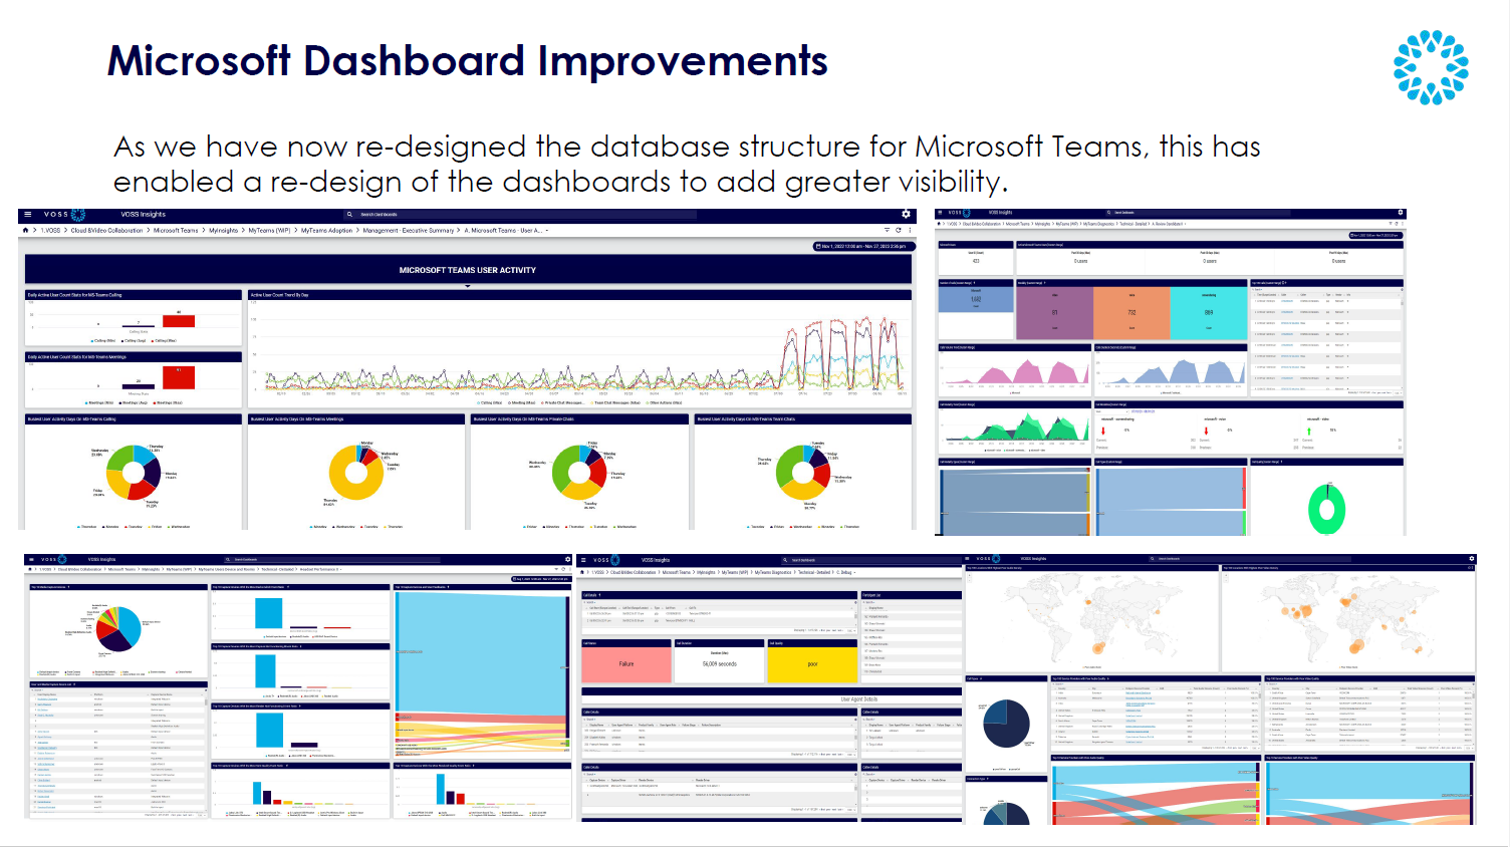
A redesigned database structure for Microsoft Teams delivers enhanced dashboards for Microsoft data, allowing additional data analytics and providing access to more intelligence and insights than before. New dashboard resource definitions enable the building and importing of the redesigned Microsoft Teams dashboards.
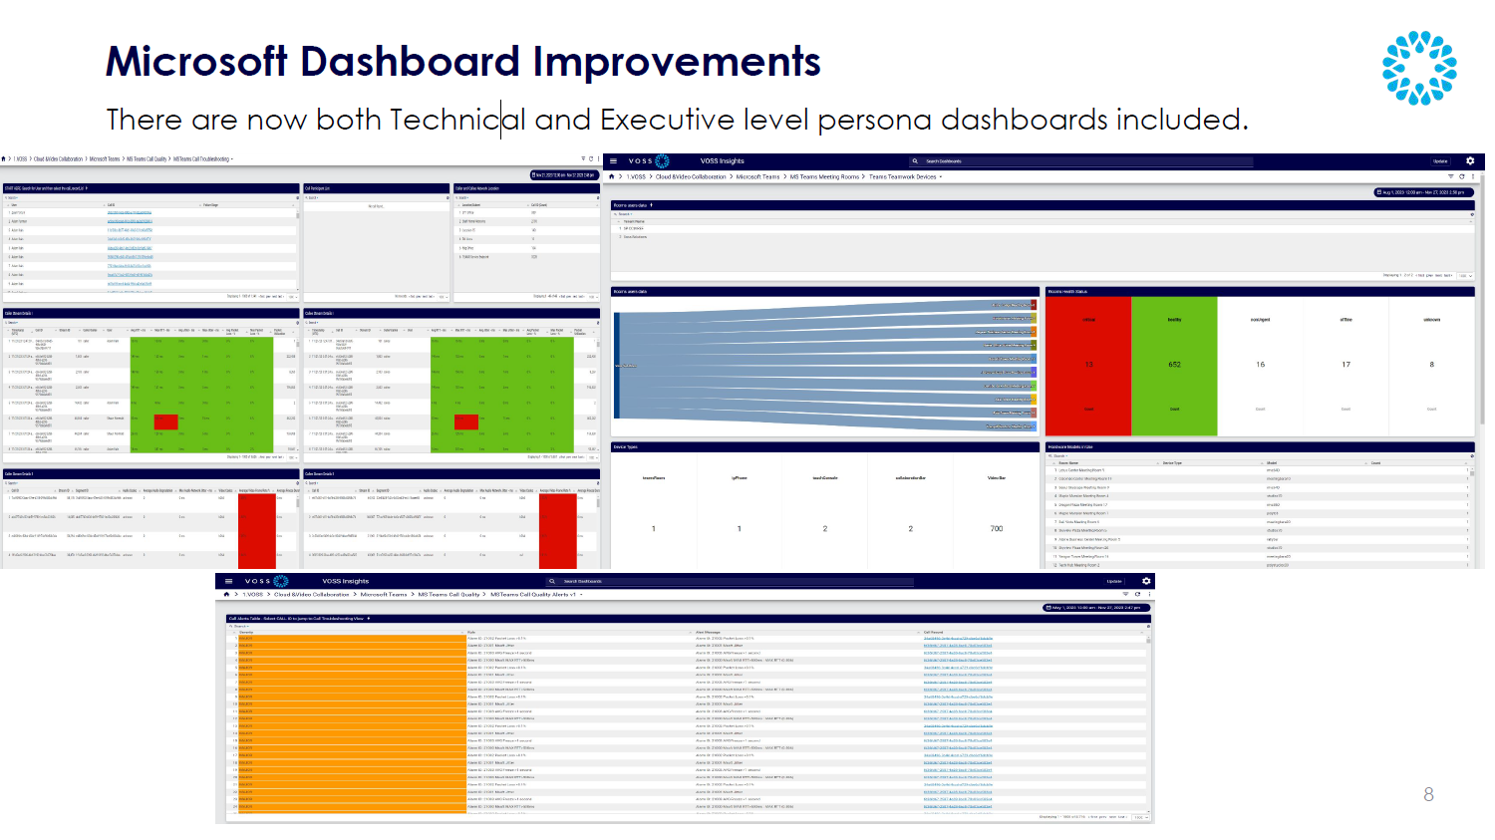
These dashboards are now grouped for executive and technical roles so that you only need to pay attention to the data you need for your role.
Avaya Aura 10 RTCP Alert Support
This feature allows our RTCP analysis and alerting capabilities to work with the new data format in Avaya Aura v10. Insights will now be able to generate alerts based on the MOS score in the RTCP data logs. This ensures that the Insights platform collects and can store and use the new RTCP data structure.

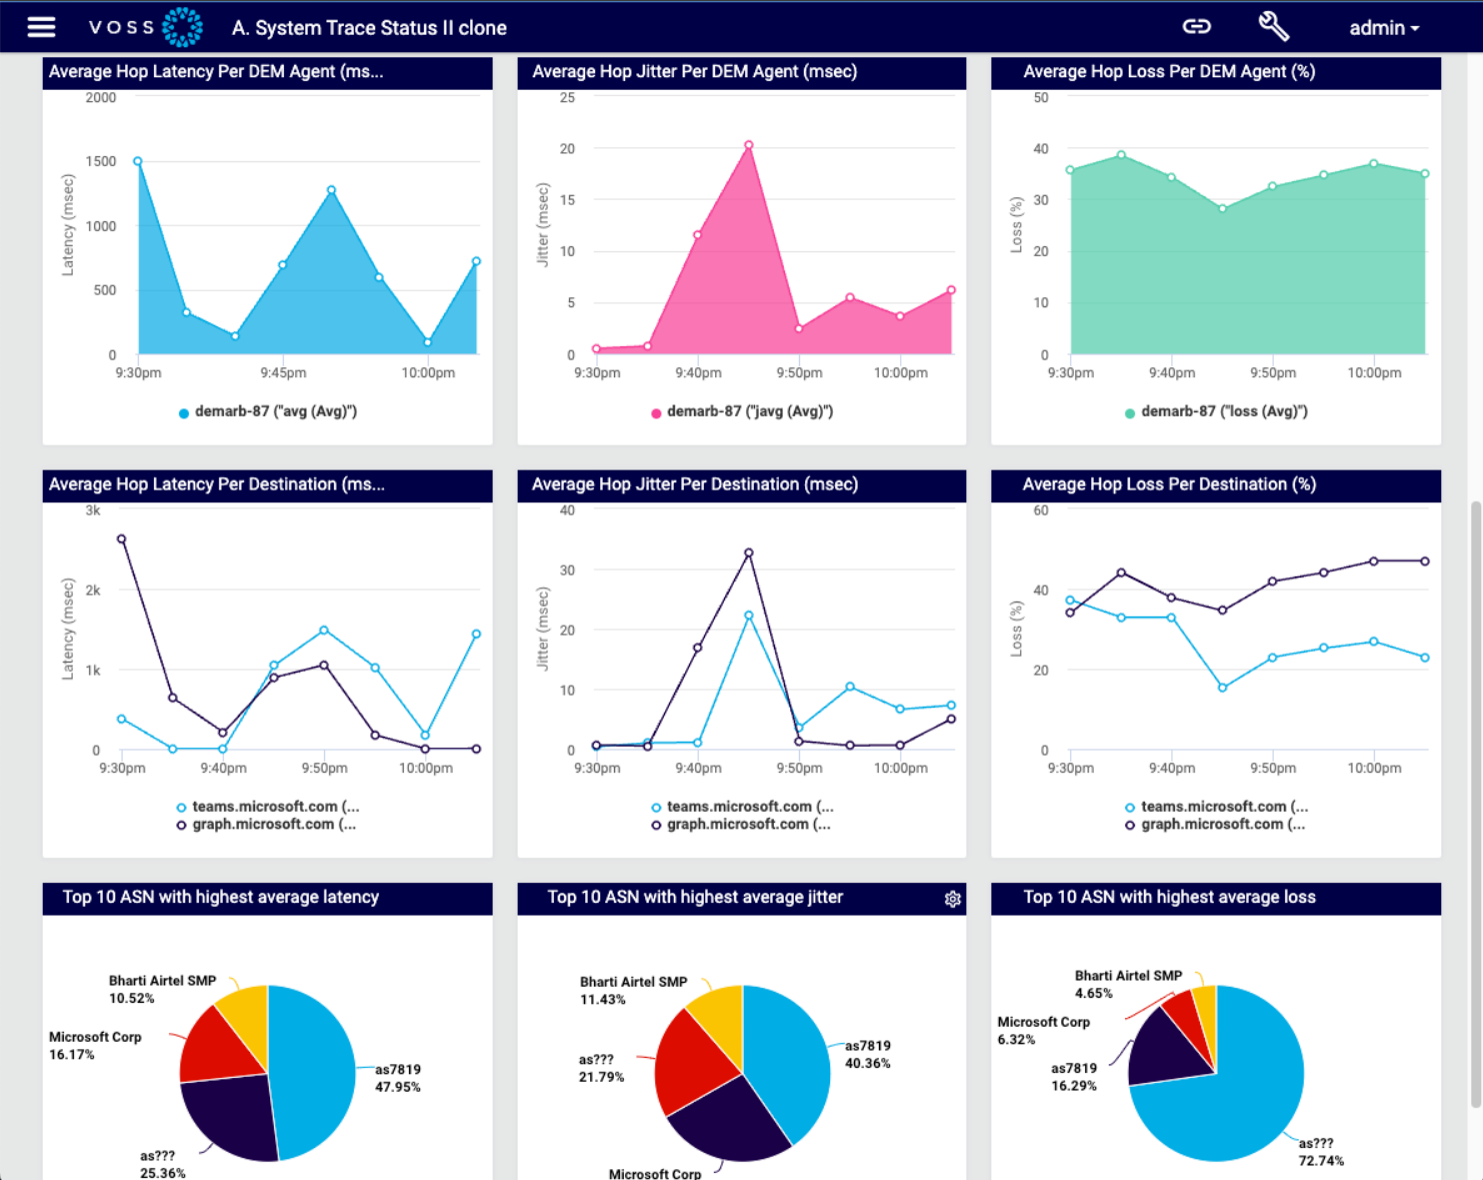
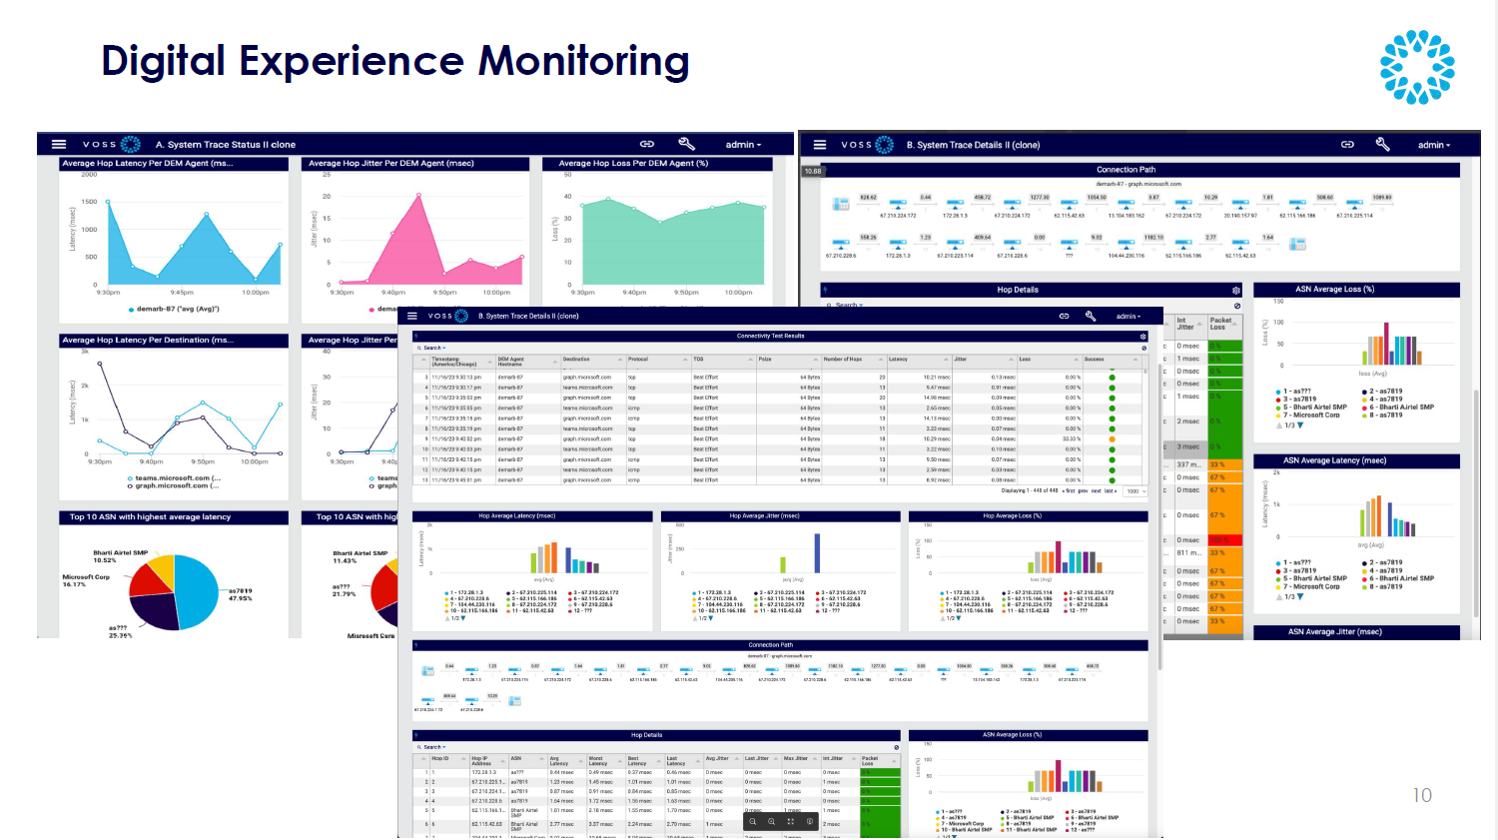
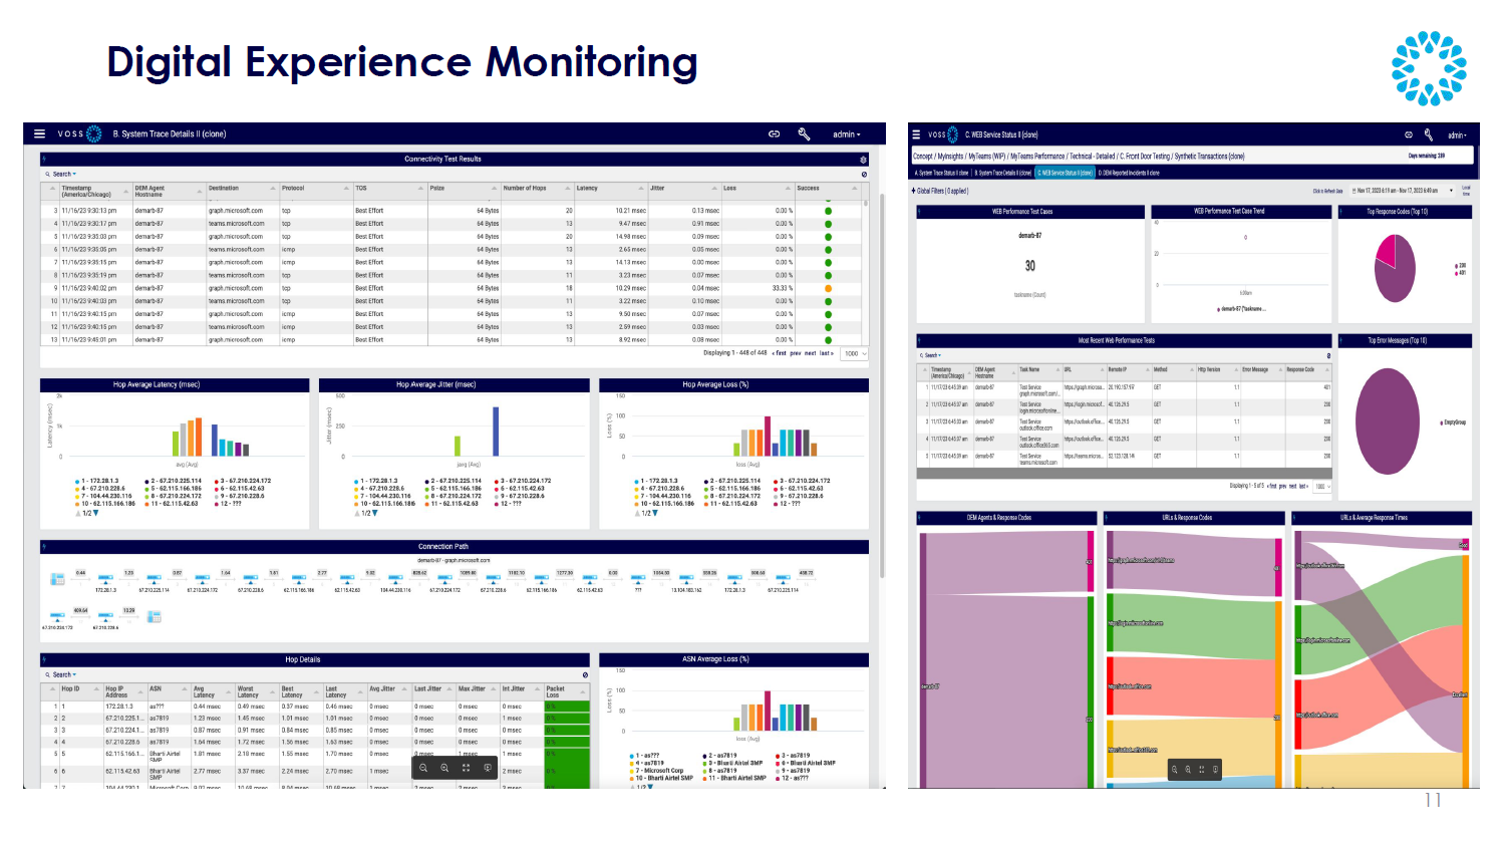
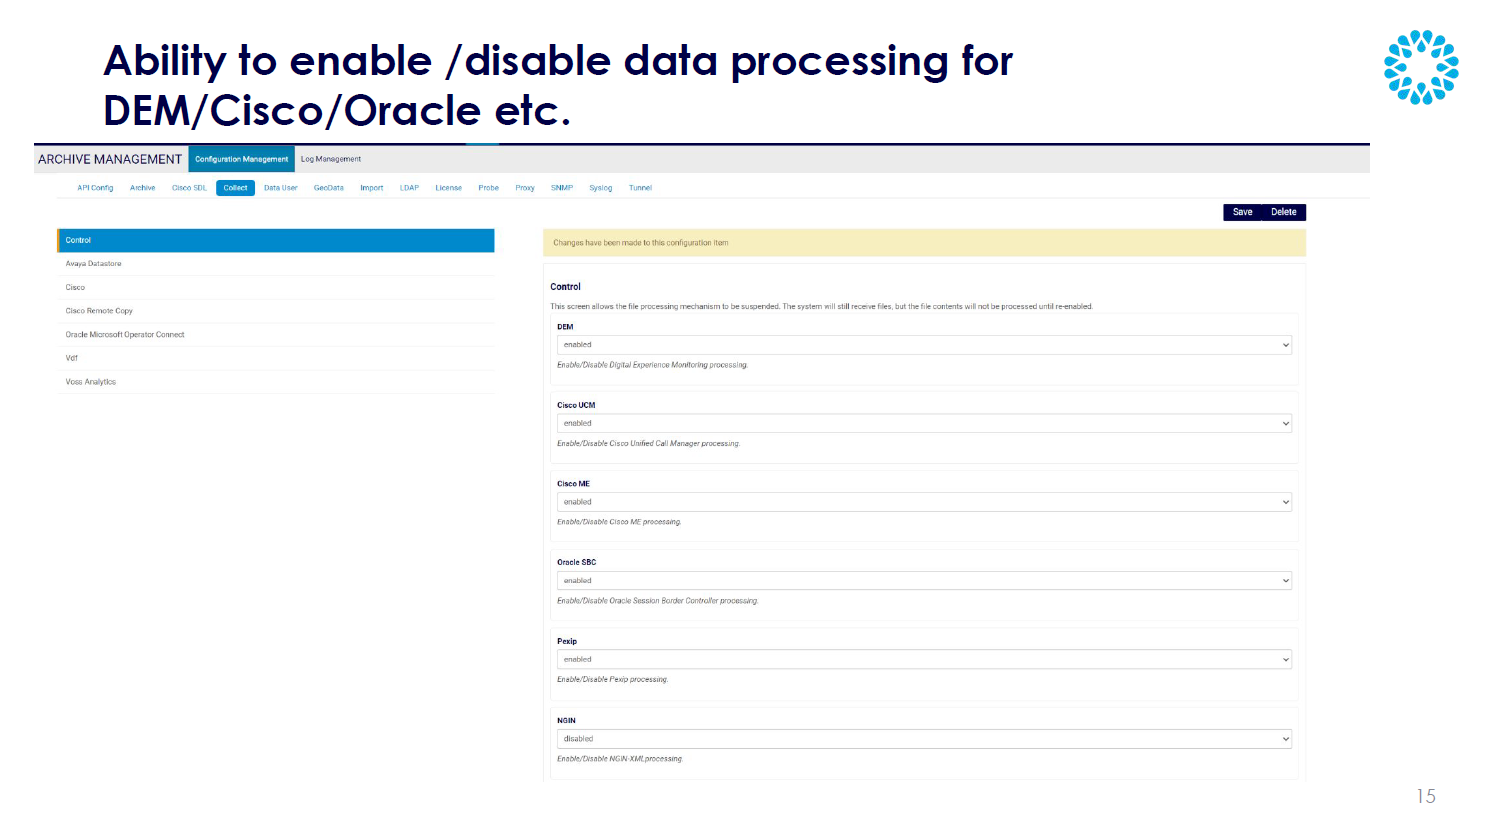
Digital Experience Monitoring
Digital Experience Monitoring (DEM) has been introduced in the Dashboard. DEM allows for testing connectivity to Web-based systems, such as Microsoft Teams. This means that alarms and alerts can now be raised when any of the DEM collected metrics are out of permitted thresholds. With DEM built in to the Dashboard, you can expect metrics for elements such as overall round trip times to the application, amount of hops taken, best and worst latency, and connection path (shown hop-by-hop). It is also possible to enable and disable DEM file processing.
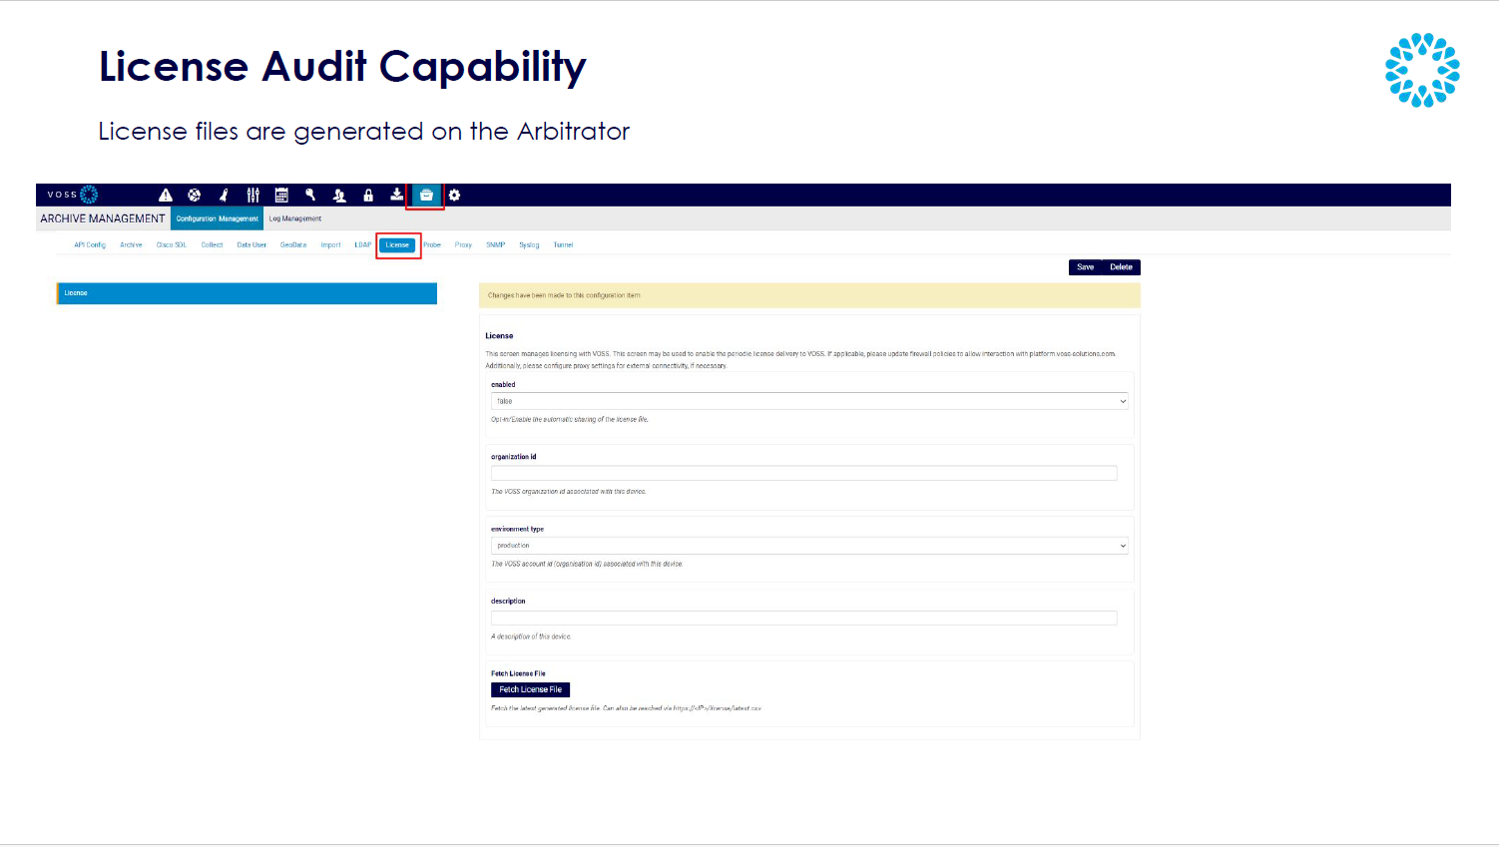
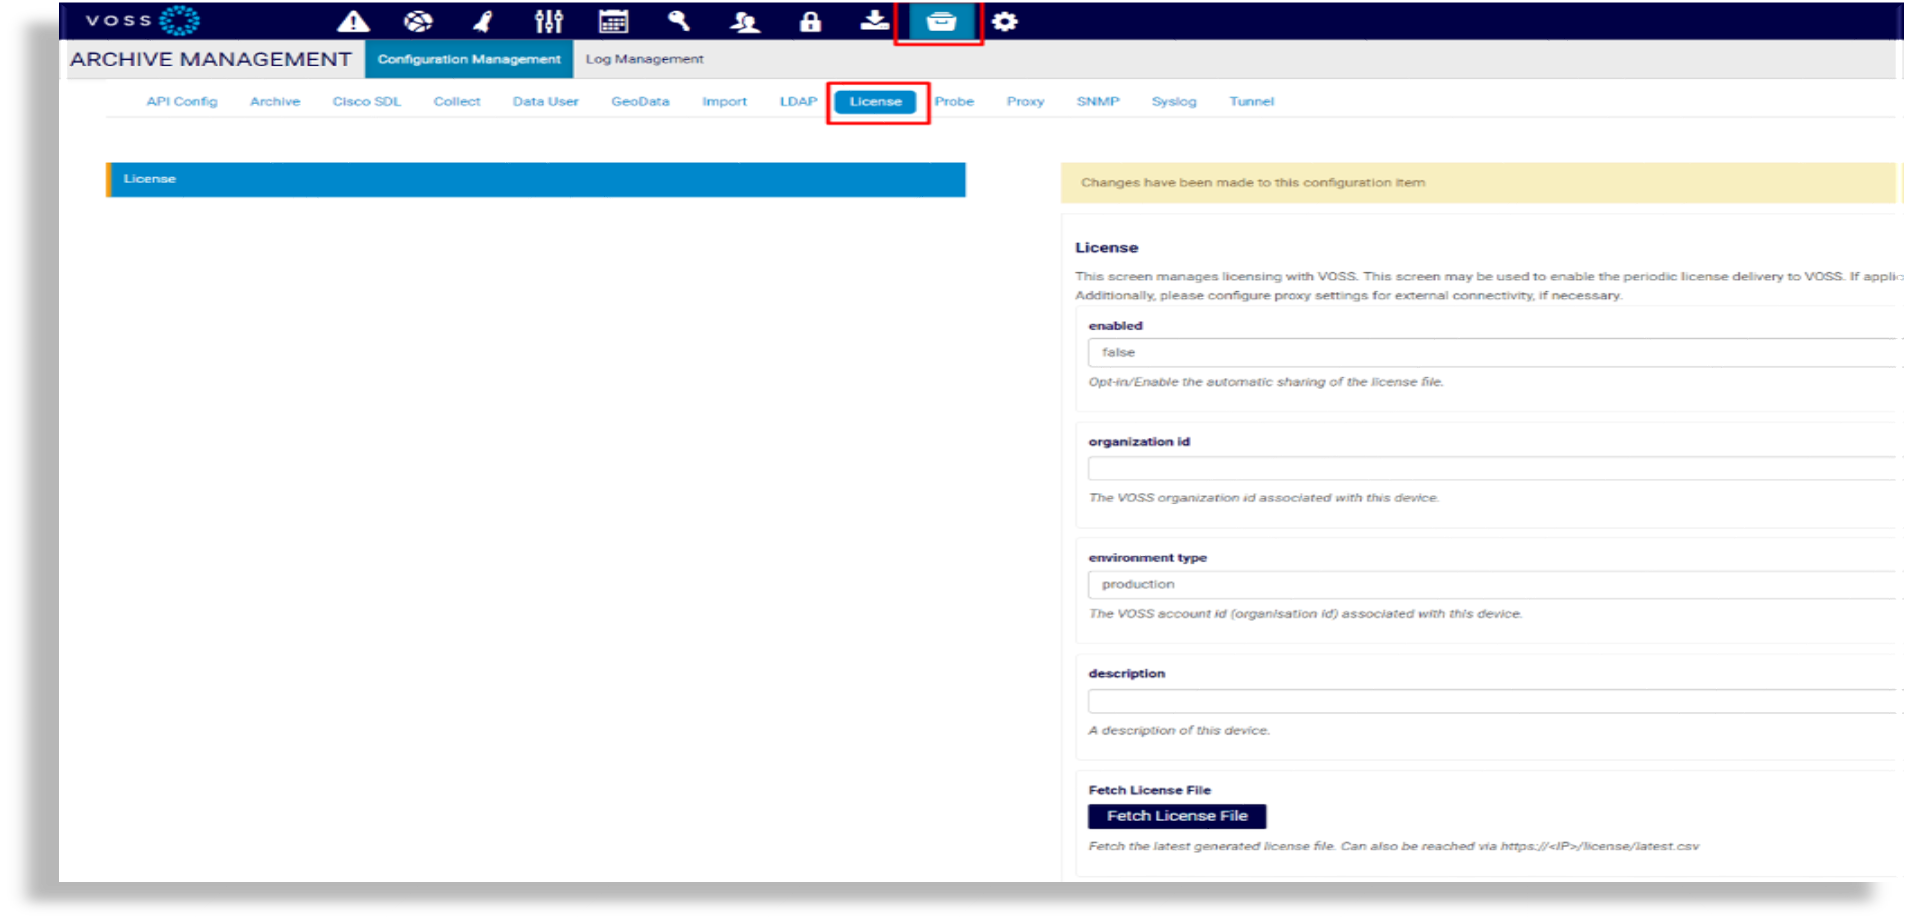
License Audit Capability
On the Arbitrator, you can now generate a license file and view your license details

Small enhancements and bug fixes
In addition to the new features and enhancements in this release, we've added several small enhancements, including a number of bug fixes. You can find further details, including links to the relevant topics, on the 23.3 Documentation Portal.