Troubleshooting the Arbitrator
Change Policy IRP in Bulk
Run the following:
psql sca

select "IRP_ID", "IRP_NAME" from "INCIDENT_RESPONSE_PROCEEDURES";

IRP_ID | IRP_NAME
-------+----------------------
6      | Push to Spark
1      | Default IRP
5      | Push to Zenoss Cloud
Take the
IRP_IDnumber next to the Responce Procedure and replace it where##is on the next commandupdate "CORRELATION_RULEBASE" set "IRP_ID" = ## WHERE "THREAT_SCORE" = 31;
Example
sca=# update "CORRELATION_RULEBASE" set "IRP_ID" = 1 WHERE "THREAT_SCORE" = 31;
Exit psql and do
lxtsv restart arbitrator
Check Lag on Central Arbitrator
If you are set with multiple arbitrators pushing alerts to a central arbitrator there may be an occasion where alerts do not show in a timely manner on the central arbitrator or the dashboard.
Log in to the GUI on the central arbitrator, go to the Config area.
Check that this arbitrator only has the catch all policy. If more policies are present then remove them.
Log in to the same arbitrator via CLI as root.
Run the following command:
/usr/local/share/kafka/bin/kafka-consumer-groups.sh --bootstrap-server localhost:9092 --describe --all-groups
This will return the below…
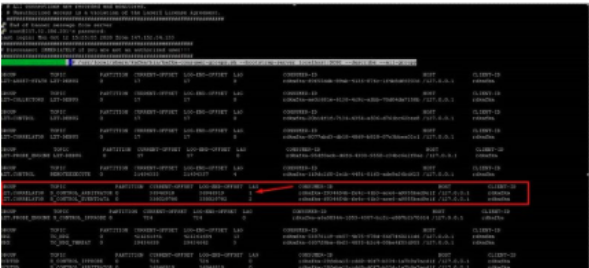
Look at the highlighted box and ensure the lag is less than 2000, run the command a couple more times to check if the number raises and falls.
If we see the number only climbing, we need to take action.
Run:
monit stop lxt-correlator

/bin/kafka_consumer -g LXT.correlator S_CONTROL_ARBITRATOR >/dev/null

/bin/kafka_consumer -g LXT.correlator S_CONTROL_EVENTDATA>/dev/null

monit start lxt-correlator
Check VPN Tunnel Between Arbitrators
To test the status go into the Arbitrator as root and run:
netstat -nealp | grep 3050
This will return the below for the tunnel

Then run
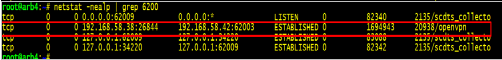
netstat -nealp | grep 6200
This will return the below for the TLS connection
Cisco CDR processing appears to have stopped
System Impact – Minor
Symptoms that CDR ingestion appears to have stopped
The system will write a log in the Index as it processes CDR files.
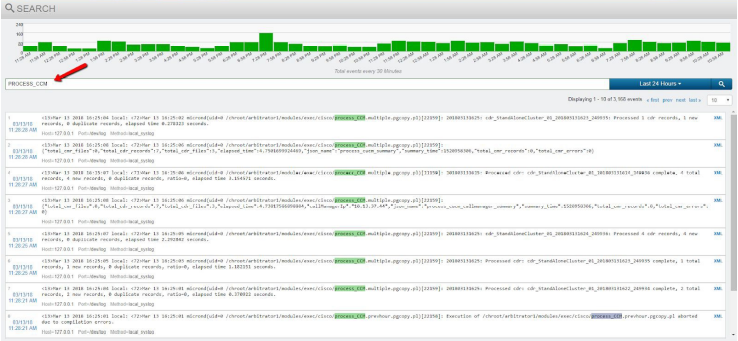
The log can be found in the Search interface using a keyword search
for PROCESS_CCM. Look at the time stamp of the last CDR processing
log as an indicator of when a CDR record was last processed in the
system.
CDR files should be received and processed every 5 minutes maximum, but that can depend on the configured interval on the CUCM for sending CDR records. The system will constantly check for new CDR files to ingest into the system.
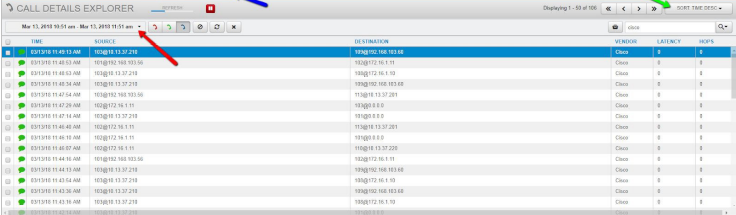
A secondary symptom of CDR processing issues, or no receipt of CDR files would be no new call records in the Call Details interface.
Sort the Calls by Time: Descending to see the most recent calls first. Choose a 1 hour time frame and look for the most recent call time stamp to validate the last call record received and processed.
Process_CCM Log Example:
Below is an example of the log in the index indicating that CDR files
have been received and processed. Use the keyword PROCESS_CCM in
the Search interface to find this log.
Mar 13 2018 16:25:04 local: Mar 13 16:25:02 micrond(uid=0
/chroot/arbitrator1/modules/exec/cisco/process_CCM.multiple.pgcopy.pl)[22159]:
201803131625: cdr_StandAloneCluster_01_201803131623_249935: Processed
1 cdr records, 1 new records, 0 duplicate records, elapsed time
0.278323 seconds.
Cisco CDR files are sent from the Cisco CUCM Publisher to the Correlation server using sftp on port 22. Validate that the Correlation server sftp function is available for connections for the file transfer.
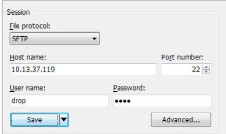
How to validate the SFTP service is up and ready to accept CDR
Use an SFTP client like WinSCP or Filezilla to connect to the Correlation server using sftp on port 22. Use the username “drop” and its password for the connection. The drop user credential is used in the CUCM Billing server configuration on the Publisher. Reference the CUCM billing server configuration for the drop user password.
When connected to the SFTP service the default directory will be /pub.
If the SFTP service is not responsive, reboot the Correlation server from the admin CLI menu using the procedure in the Corrupted Index section of this document.
What else should I troubleshoot in this scenario?
Try connections to the SFTP server from a system in the same subnet if possible just to remove any potential network connectivity issues for the test. Test the SFTP connection from a system in the same subnet as the CUCM Publisher.
If SFTP service is available on the Correlation server, the system can receive CDR files. The issue will then be either network connectivity or an issue on the CUCM Publisher.
If Cisco has an issue sending CDR files to billing server destinations it will generate a syslog alert in the Correlation system (if the rule to catch it is in the system). The alert log will indicate details about the CDR transfer issue and destination of the files.
Clear Disk Space
To clear disk space being used by archive
To identify if the archive is using massive amounts of disk space, log in to cli as root.
Then enter the following command and press <Enter>
~/bin/check_disk.sh
This will return the screen below
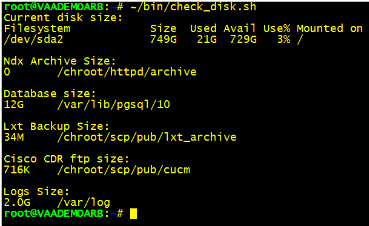
If the
Ndx Archive Sizeis huge we need to clear it down.Change your directory
cd /chroot/httpd/archive
Important
Do not run the next command unless you are in this directory.
Now run
rm -rf *
Once this has finished run:
sv restart arbitrator_ndx
Once the service has restarted you can now run
~/bin/check_disk.sh
again to confirm that the space has now been freed up.
Drop Tables to free up Disk
Find the tables with the biggest in size
/root/bin/`dbTableSizes.v2.sh
This will list the tables and size
Drop tables
/root/bin/dropTables.sh <Table name pattern - can be partial> <Table date - YYYY_MM>
For example to delete RTMT data for
2020_03/root/bin/dropTable.sh "RTMT" 2020_03
This command simply prints the psql commands and the table names. It does not actually do any deletes yet. Confirm the list is what you want. If not adjust search and date accordingly.
Final command to commit delete is same command with
| psql sca
Manually Pull Phones into Arbitrator
Log in as root to CLI
Change directory to
/chroot/arbitrator1/modules/exec/cisco/cucmrisphone
Then run the pre-canned script
./collectrisphones.sh <ip of cucm> <axl username> <axl password>
RTCP call data appears to have stopped
System Impact – Minor
Symptoms that RTCP ingestion appears to have stopped
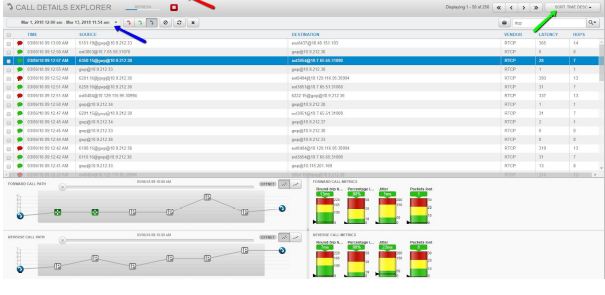
No new RTCP call records in the Call Details interface.
In the Call Details interface, sort the Calls by Time: Descending
to see the most recent calls first. Choose a 1 hour time frame and
look for the most recent call time stamp to validate the last call
record received and processed.
The SCDTSD service mentioned earlier in the document controls the ingestion of the RTCP data, so if SCDTSD has an issue it will impact RTCP data as well. Validate the integrity of the SCDTSD service.
What else should I troubleshoot in this scenario?
RTCP is sent from every phone in every network region to the Correlation server on the default port 5005. Validate that the RTCP destination configuration has not changed on the UC application.
Set Alarm Expiry Timers
update "INCIDENT_RESPONSE_MAPPING" set "TIMER" = 86400;
updates alarm expiry from the default to 24 hours
The local OpenLDAP service has stopped
System Impact – Minor
Symptoms of a down openldap service
Local administrative users are created and stored in the instance of OpenLDAP on the Correlation server. If the service is ever stopped, local users cannot authenticate to access the GUI. Users synchronized from a SAML or AD repository are also affected and will not be able to access the GUI.
The OpenLDAP service state does not affect normal system processing, so logging and alerting functions will continue.
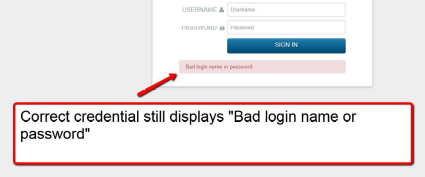
How to restore local system authentication for the GUI
The system will need to be restarted from the admin CLI menu to resolve the OpenLDAP issue.
The main Arbitrator Service is DOWN
System Impact – Critical
About the Arbitrator service
The main correlation engine service on the system is called Arbitrator. It controls all of the alerting, probe, and automated response procedure operations. It also is the mechanism that actually writes to the Index file “hot” bucket.
Symptoms of a down Arbitrator service
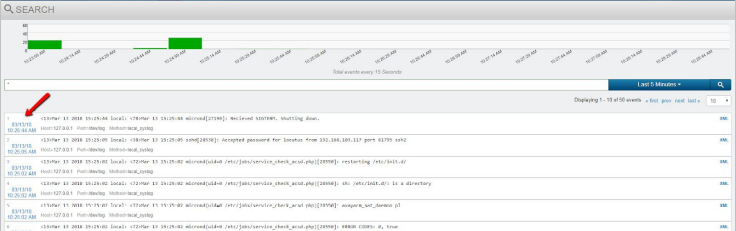
When the Arbitrator service is down, no new logs or events can be written to the Index. The Search interface will look responsive since the Index is not corrupted. Use the log time stamp to validate that new logs are not being written into the Index.
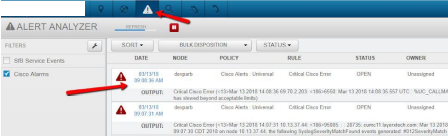
Use the Alert Analyzer interface to validate that no new alerts have been created. Look at the time stamp of the latest alert in the system to further validate if the Arbitrator process has stopped.
Other side effects of a stopped Arbitrator process
- Cisco CDR files will not be processed - no new calls in the Call Details interface
- Avaya RTCP stream data will not be processed - no new calls in the Call Details interface.
How to restart the Arbitrator service
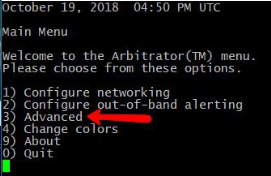
To restart the Arbitrator process in the Correlation system, ssh to the system and login as the “admin” user to access the admin CLI menu. From the Admin Menu select the Advanced ARB Options menu to navigate to the Main sub menu. From there select option 3 Advanced, and then option 1 Restart arbitrator to restart the Arbitrator process. This is not a reboot of the system, it is only a restart of the main Arbitrator process. For those that may not know, Arbitrator is the legacy name of the Correlation system. In can still be seen referenced in some documentation and the admin CLI menu until the resources are updated.
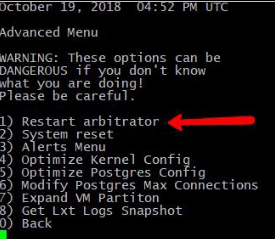
Press <ENTER> to exit the operation when prompted and return to the menu.
Use the Search interface in the GUI to validate that new logs are being written into the Index by looking at the log time stamp. The green graph at the top of the Search interface is an indicator of log events being written into the Index in that time frame.
The system Index file is corrupted
System Impact – Critical
About the system Index file
The Index file in the correlation server is the main text file that all logs, traps, probe return data, and system logs are written to and then processed by the Correlation engine. It is the main archive of raw log data, and rotates as it archives from a “hot bucket” to a “cold bucket” The current Index that is being written in the system is the “hot bucket”, while archived Indexes are “cold” and no longer actively being appended. The Index file that is affected in the problem description is the current “hot” or active Index file.
How the Index becomes corrupted
The Index becomes corrupted when either the Virtual Machine is improperly shut down in the VMWare management interface, or the VMWare host has an issue that removes CPU or disk resources from the system while it is writing to the file.
Important
Do NOT Power Off, Suspend, or Reset the Correlation system from the VMWare management interface!
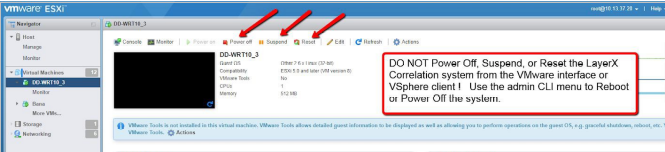
How to properly reboot or power off the system
To properly power off or reboot the Correlation system, ssh to the system and login as the “admin” user to access the admin CLI menu. From the Main Menu use the arrow keys to navigate to the ‘Reboot’ option to reboot the system or ‘Power Off’ to power off the system. These operations will properly stop the system services and close the Index file so that it does not become corrupted.
Symptoms of a corrupted Index
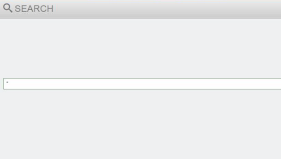
If the index is corrupted no new data can be written into the system. From the Correlation server GUI use the Search interface to look at the Index . When the index is corrupted the Search interface will return no data and look blank since the corrupted index cannot be read or accessed.
Side effects of a corrupted Index are no new alerts can be generated since no data can be written into the system and processed by the Correlation engine.
Example of a blank Search screen as a result of a corrupted index.
How to repair a corrupted Index file and restore operation
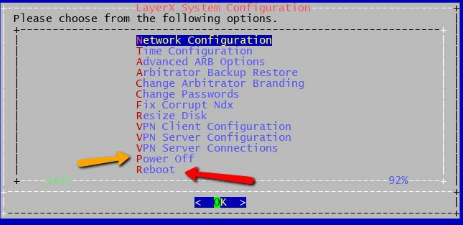
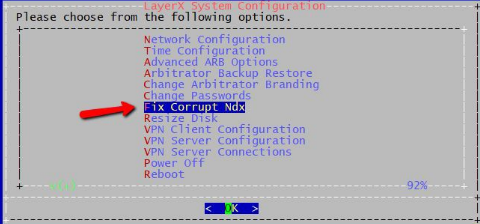
To properly repair the Index in the Correlation system, ssh to the system and login as the “admin” user to access the admin CLI menu. From the Main Menu navigate using the arrow keys to select option Fix Corrupt Ndx to fix the corrupted Index.
When running the “fix” Index operation there will be a WARNING prompt before proceeding.
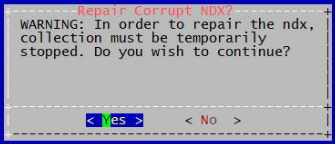
Select <YES> and Press <ENTER> to execute the operation. Press <ENTER> when prompted upon completion to return to the menu.
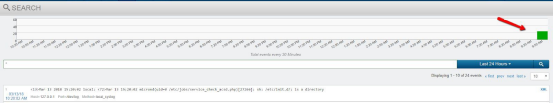
Use the Search interface in the GUI to validate that new logs are being written into the new Index “hot” bucket. The green graph at the top of the Search interface is an indicator of log events being written into the Index in that time frame.
Threat Scores
info = 0
minor = 11
major = 31
critical = 60
To disable policies in Bulk
psql sca -c 'update "CORRELATION_RULEBASE" set "STATUS" = 0 WHERE "THREAT_SCORE" =11;'
disables all Minor alarms
psql sca -c 'update "CORRELATION_RULEBASE" set "STATUS" = 0 WHERE "THREAT_SCORE" =0;'
disables all Informational alarms
Truncate System Logs
If you run
/root/bin/dbTablesizes.v2.sh
and the SYSTEM_LOG is over 10GB in size you will need to truncate the log:
Log in as root
Then from the command line
psql sca -c 'truncate "SYSTEM_LOG"'
This will then truncate the log.