Main Menu
Clicking Main Menu ![]() opens the main menu.
opens the main menu.
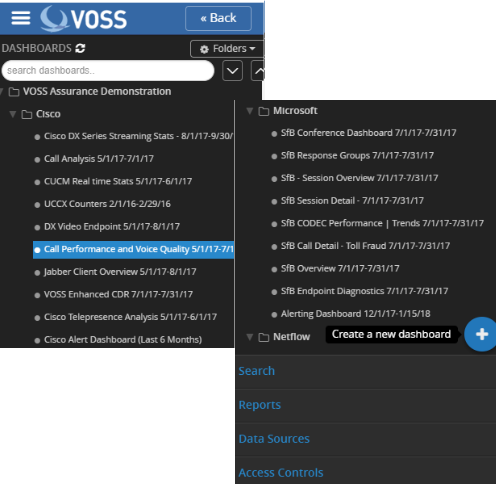
All dashboards, reports and their associated folders are located in this section. If search definitions have not been performed then there will not be any folders or dashboards shown. See below on creating search definitions.
As dashboards are created they can be organized into folders that expand out into trees based on your logical order desired. Simply click Folders to define and name a new folder then drag your Dashboard into that folder. A search bar is present that allows for rapid locating of dashboards by searching their name.
There are four menu options located towards the bottom of the main menu:
- Search: Clicking here takes you to the main search screens where all logs are stored in a JSON index data store (see details below).
- Reports: Clicking here takes you to the Report Scheduler. This is where each report can be scheduled based on customer, duration, repeat timeframe and email address.
- Data Sources: Clicking here takes you to the section where you can define multiple data sources to extract data on which to analyze and report.
- Access Controls: Clicking here takes you to the section where multi-tenant customers and users are set up along with each user’s associated log in credentials.